Categories
About UsHow to get startedAccount AccessPaper Trading
Paper Trading is a built-in WealthCharts feature that allows you to practice your trading in an almost real-life environment without the stress and risks associated with putting your own money on the line. Using the built-in feed, “paper” trades can be placed and closed in real-time, just like they would when you are trading with a real broker account. WealtCharts Paper Trading utilizes all of the same tools that you would be working with when using a broker account and offers performance reporting that is also on par. This is invaluable if you are looking to test a new trading methodology or just hone your trading skills in general!
Getting Started
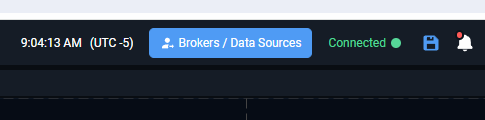
To begin with, you will need to enable the WealtCharts Paper Trading feature. Just like everything about paper trading, this works in a very similar manner to using an actual broker account, so first things first, you will need to go to the Broker and Data Sources menu at the top of your trading platform:
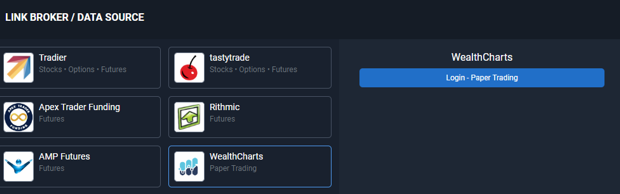
Here, select WealthCharts Paper Trading, and click the Login button:
At this point your connection to our Paper Trading servers should be established, and just as with a live broker connection, the paper trading connection status will be displayed in green in the toolbar at the top of your platform:
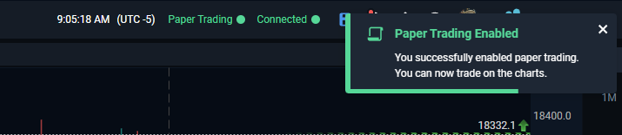
You are all set to start paper trading! Paper Trading works just like regular trading, so in order to place and manage your paper trades, you will need to use three of the WealthCharts trading tools: the Trading DOM, the Broker Portfolio, and a tool unique to paper trading, the Paper Trading Stats. Please refer to the DOM and Broker Portfolios articles, but here’s a brief overview:
Trading DOM
The Trading DOM is the primary tool for placing your trades. Here, use the search button at the top to pick a symbol first – once a symbol is picked, the DOM will come to life:
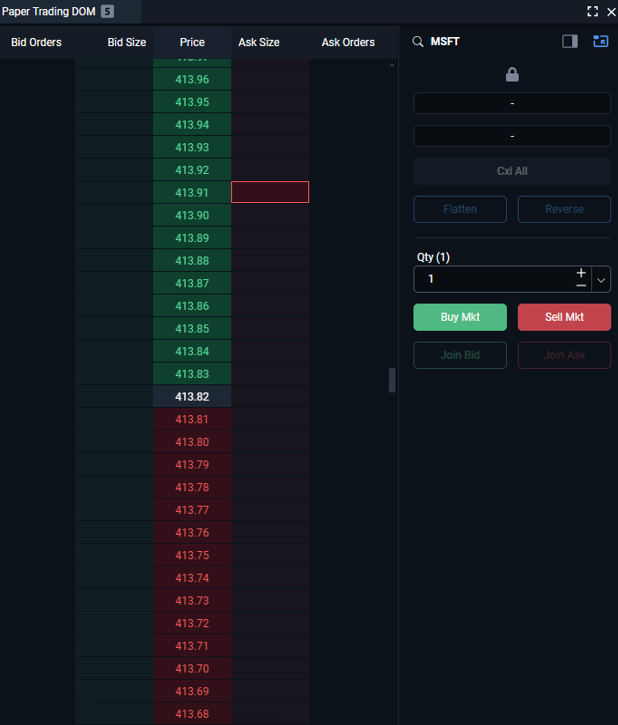
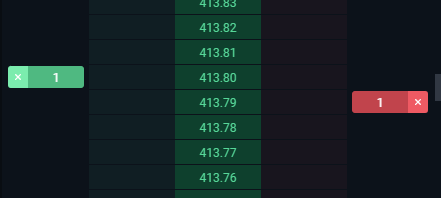
The DOM consists of two parts – the price ladder and the order panel. The price ladder displays the current price of the stock and allows clicking in the Bid Size and Ask Size columns next to the desired price levels to create Stop/Limit orders at those price levels accordingly. Such pending orders will be displayed in the DOM, and can be adjusted by dragging them up and down as well:
The Order Panel offers additional buttons that allow you to place Market buy/sell orders, or join the nearest Bid/Ask. Additionally, the trade size can be defined here, and there are flatten, reverse, and cancel buttons, that allow you to get out of any existing positions, reverse your position in the opposite direction and cancel any existing pending orders accordingly.
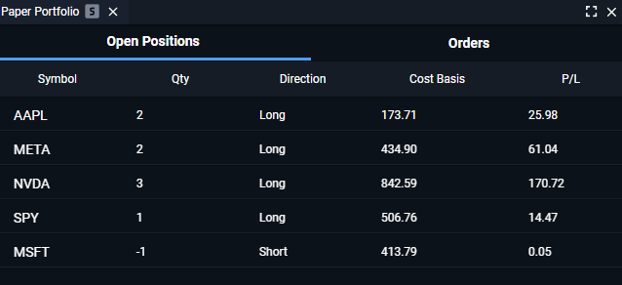
Broker Portfolio
The Broker Portfolio offers detailed data on your current positions, as well as any orders, past and current. Note that there are two tabs at the top of this window – Open Positions and Orders!
Paper Trading Stats
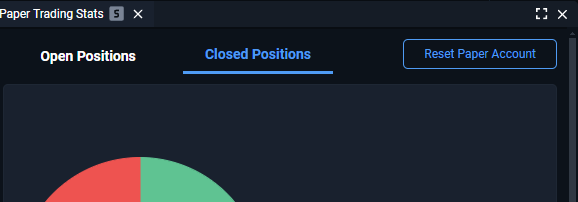
The Paper Trading Stats tool consists of two tabs that are available at the top – Open Positions and Closed Positions.
Open Positions
Here, you will find additional stats about the current performance of your account and any trades that you carry. This is similar to the Open Positions tab in the Broker Portfolio, but a bit more detailed. Here are some of the datapoints available:
Current Value of Portfolio – the total value of all the trades currently carried on your paper trading account.
Invested Value – the amount of funds invested originally to launch all of the trades that are active at this time.
Total Profit/Loss Value – the total amount of profits or losses generated by currently open positions.
Total Profit/Loss % - – the total amount of profits or losses generated by currently open positions as a percentage value compared to invested funds.
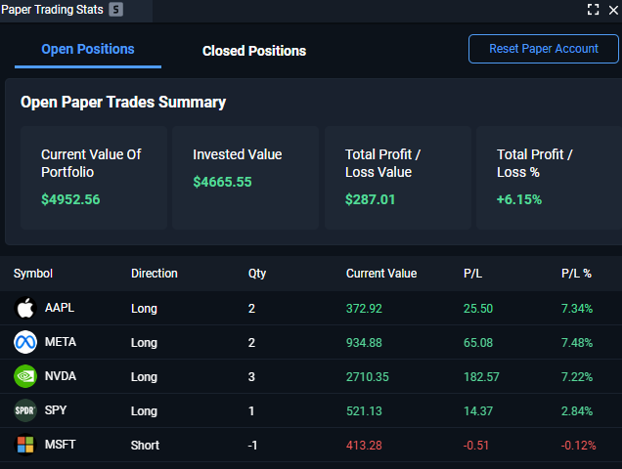
While the above metrics are aggregated for all active trades, right beneath them, a detailed performance breakdown is available on a per-trade basis.
Closed Positions
A breakdown of your paper trading performance based on past trades that have already been closed is available here. Here, a pie chart offers a breakdown of losses to wins as a % value, while the graph right next to it offers insight into the sum of money gained or lost with profits and losses.
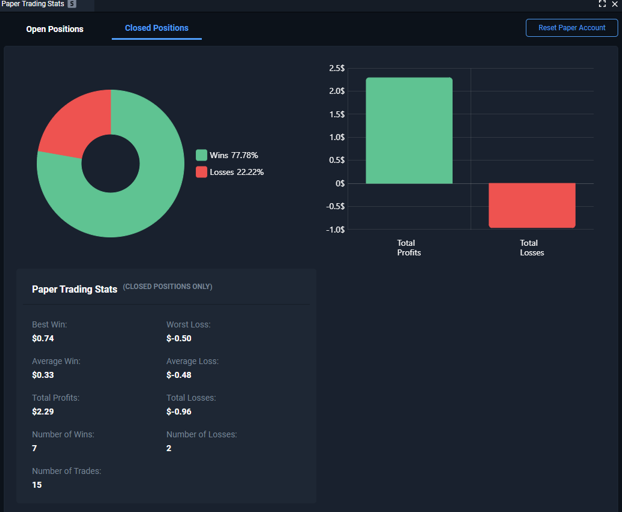
Additional stats are available below:
Best Win/Worst Loss – the largest winning and losing trade from your trade history so far.
Average Win/Loss – the average amount won and lost based on all of the closed trades.
Total Profits/Losses – the total amount gained/lost based on all of the closed trades.
Number of Wins/Losses – the number of trades won and lost.
Number of Trades – the total number of trades undertaken.
Want to start from scratch?
If you would like to completely reset your paper trading performance stats and start from scratch, just use the “Reset Paper Trading Account” button in the top right corner. Doing this will wipe all active trades as well as the history of past ones, allowing you to resume practicing your trades with a clean sheet!