Categories
About UsHow to get startedAccount AccessBrokers and TradingChartsScannersResearch ToolsCommunityStocksOptionsFuturesAlertsChart Features & Settings
Take your technical analysis to the next step while being on the go with Chart Features and Settings!
To find the Chart Features and Settings menu, all you have to do is tap the 3 horizontal dots at the bottom right corner. This will show you a menu consisting of:
Indicators
Tapping this button will take you to the Indicators menu, where you can apply or remove indicators from the WealthCharts Exclusive section, the Marketplace section, as well as the Premier and Standard sections.
Draw
Tapping this button will take you to the Drawing Tools menu, where you can apply drawings from the Lines, Shapes, Fibonacci, and Text categories. To customize your Drawing Tools, be sure to tap the color wheel icon located at the top of your chart once you've applied the drawing.
Alerts
Tapping this button will allow you to place Price Alerts on your chart. Please note that you can only apply alerts for LMAX Data, Equities, and ETFs. A menu will open allowing you to enter a price for where you want to be alerted at. Afterward, you can choose to be alerted via an SMS text message, an Email, or a Push Notification.
Change Style
Tapping this button allows you to change the bar style of your chart. You can choose from a Line chart, Candlestick chart, Area chart, OHLC Bars, Heikin-Ashi chart, Kago chart, or Renko chart.
Settings
Tapping this button will allow you to Reload your Chart in case you need to go back to the WealthCharts default scaling, Share Chart so you can post your analysis on WealthThoughts, and Global Settings where you can change the following:
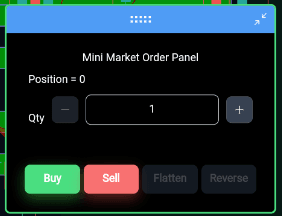
Show Mini Market Order Panel: This panel allows you to quickly place trades on your chart without having to load the order panel from the Trade button at the bottom!
Show Indicator Alerts: This setting allows you to see messages located at the top of your chart when certain indicator signals have fired off! These alerts do not have sounds, SMS, or push notifications capabilities at this time.
Show Price Volume: This allows you to put Price Volume across your chart starting from the left side.

Show Last Price Line: This setting shows you the last recorded price of a symbol on the right side of your chart in the price axis. It also displays a count-down timer too if you are using an hourly chart or under.
Show Trade indicators: This allows you to see and move trade orders and positions on your chart. If this is off, you will only see dashed lines and you will not be able to move them.
Show Indicator Titles: This setting shows you which indicator you have on your chart by displaying each indicator title at the top of your chart. If you have sub-chart indicators, the titles will appear at the top of each sub-chart as well.

Show Real-Time Premarket Data: This setting will show you Real-Time Premarket Data for avaialble equities.
Set Font Size: Changing the font size setting will increase the text in price axis, date axis, indicator titles, and the chart information located at the top.
Set Time Zone: Changing the Timezone here will make the timestamps change at the bottom of your chart. You can change the timezone at any time!