Categories
About UsHow to get startedAccount AccessBrokers and TradingChartsScannersResearch ToolsCommunityStocksOptionsAlertsHow to use on chart trading
On Chart Trading - Options
Trading directly off your chart is a necessary component, that allows you to circumvent having to open a full-out Option Chain window when looking to place orders, and quick access to the price levels intended for the trades.
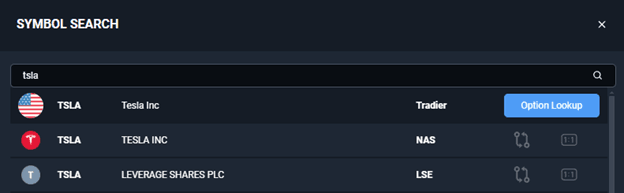
With Options, before an option trade can be accessed directly off a chart, a key step is to ensure that the desired option contract is loaded on the chart beforehand. To do this, go to the symbol search menu, and select “Option Lookup” next to the symbol you want to use.
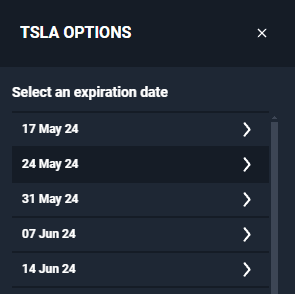
Next, select an appropriate expiry date.
Finally, select whether you want to go with a call or a put next to the desired strike price.

Now, you will see your chart change to this specific option symbol – you are ready to place your trades and manage your orders off this chart!
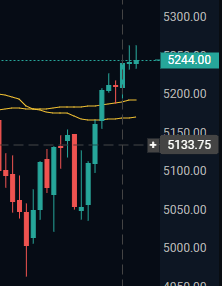
In WealthCharts, when hovering over a chart, you will typically see your crosshair project onto the price scale on the right edge of the chart, pointing out which price level your cursor is hovering over at this time. Right next to this price label, there is a small “+” button.

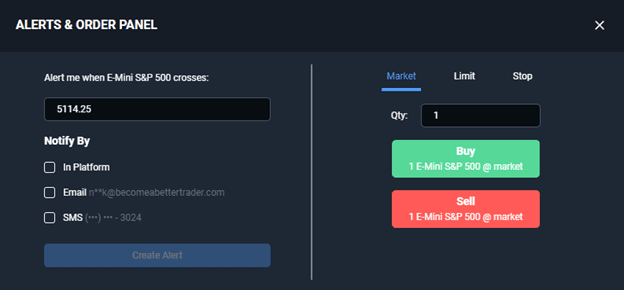
Hover over the price level that you would like to use for the order that you are about to place and click the “+” button. This will call up the Alerts & Orders window, which is where you can place the order. Note that the left part of this window is used for alerts, which is covered in our article about creating price alerts, here however, we will be looking at the area in the right part of this window, which is where orders can be made.
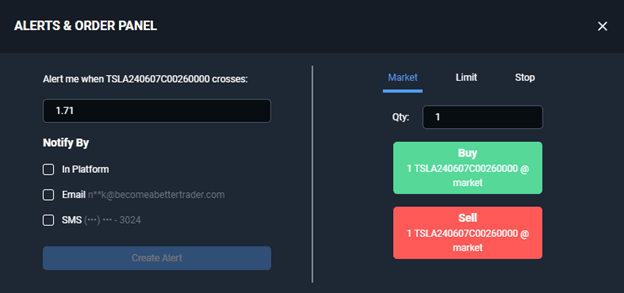
The orders area is split into three tabs: Market, Limit, Stop.
Market
Here, you can place a simple market order. Just specify that quantity for your trade and click the Buy or the Sell button.
Limit & Stop

This area has some additional features available – in addition to the quantity and direction of the trade, a limit or a stop order will typically have a price level at which it is supposed to be executed. This price field will automatically be populated with the price level that you were hovering over before clicking the “+” button mentioned earlier.
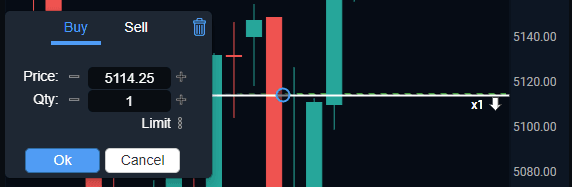
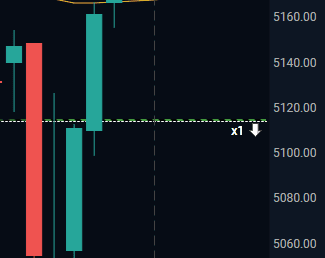
Once an order is placed, it will also be displayed on your chart as a horizontal dashed line, exactly at the price level used for the order.

Clicking on this line allows you to adjust it directly on the chart – once clicked, the line will be highlighted with a white horizontal line that can be dragged up and down with your cursor. Additionally, a trade management window shows up on the left of the chart, where the price level and quantity can be adjusted, or the entire order can be canceled using the “trash can” icon in the top right corner.
On Chart Trading
Trading directly off your chart is a necessary component, that allows you to circumvent having to open a full out DOM window when looking to place orders, and quick access to the price levels intended for the trades.
In WealthCharts, when hovering over a chart, you will typically see your crosshair project onto the price scale on the right edge of the chart, pointing out which price level your cursor is hovering over at this time. Right next to this price label, there is a small “+” button.
Hover over the price level that you would like to use for the order that you are about to place and click the “+” button. This will call up the Alerts & Orders window, which is where you can place the order. Note that the left part of this window is used for alerts, which is covered in our article about creating price alerts, here however, we will be looking at the area in the right part of this window, which is where orders can be made.
The orders area is split into three tabs: Market, Limit, Stop.
Market
Here, you can place a simple market order. Just specify that quantity for your trade and lick the Buy or the Sell button.
Limit & Stop

This area has some additional features available – in addition to the quantity and direction of the trade, a limit or a stop order will typically have a price level at which it is supposed to be executed. This price field will automatically be populated with the price level that you were hovering over before clicking the “+” button mentioned earlier.
Once an order is placed, it will also be displayed on your chart as a horizontal dashed line, exactly at the price level used for the order.
Clicking on this line allows you to adjust it directly on the chart – once clicked, the line will be highlighted with a white horizontal line that can be dragged up and down with your cursor. Additionally, a trade management window shows up on the left of the chart, where the price level and quantity can be adjusted, or the entire order can be canceled using the “trash can” icon in the top right corner.
