Categories
About UsHow to get startedAccount AccessBrokers and TradingScannersResearch ToolsCommunityStocksOptionsFuturesAlertsMobile AppDrawing Tools
WealthCharts offers a wide range of drawing tools for your charts - ranging from simple lines to complex Fibonacci or Gann-based tools. Drawing tools can be accessed under the categorized section of the Chart Toolbar on the left of your screen, or in the right-click menu, under the Drawing Tools section.
Applying and Adjusting Drawing Tools
While each drawing tool is unique and will offer different features and ways to use it, there are some rules that will be common for all of them. Let’s take a closer look at these below.
Applying a drawing tool to a chart
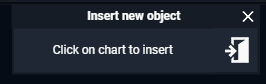
Once you select a drawing tool that you would like to use, the drawing needs to be placed in a desired spot on the chart. When this stage is underway, your mouse cursor will change to a “hand”, and a small “Insert New Object” window will show up at the top of the chart.
Adjusting the position of a drawing tool
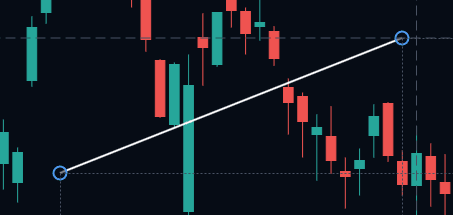
Most drawing tools will have one, two, or more key points that can be moved on the chart to change the size and the position of the drawing tool. These points can be moved by dragging them, and will be indicated as small blue circles.
Editing a drawing tool
When your drawing is in the process of being edited or adjusted, you will see a “Modify” window with various settings showing up at the top of the chart. If you have already saved the drawing tool on your chart, you may return to editing it anytime, by clicking on it.

This window will typically offer several actions that can be done here:
- The green checkmark allows you to save the drawing tool on the chart.
- The round colored palette button offers access to various settings and styling for your drawing tool.
- The magnet enables/disables “magnetic mode”. When this is enabled, dragging the circles that allow you to edit the drawing tool will see them snap into corresponding price levels when you bring them close to bar opens, highs, closes or lows.
- The button with two pages allows you to create a duplicate copy of the drawing tool that is being edited currently.
- The trash can icon allows you to delete the drawing tool from your chart completely.
Drawing tools come in 6 categories:
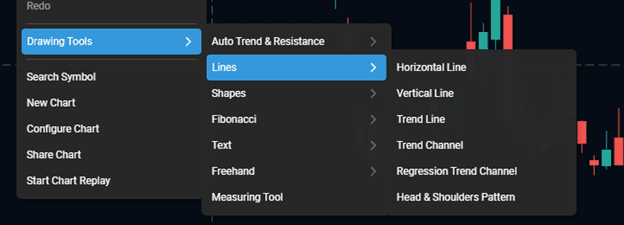
Lines
These are line-based tools, with some of the most commonly used items falling under this category:
- Horizontal lines, used to highlight a particular price level on your chart.
- Vertical lines, used to highlight a particular timestamp on your chart.
- Trend Lines, used to analyze trends, can be placed in all directions on the chart.
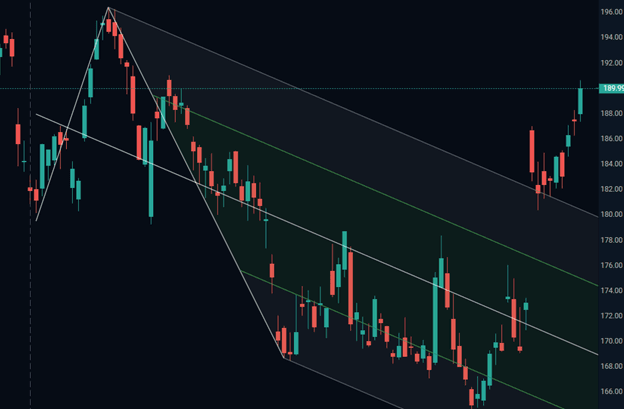
- Trend Channel, a variation of the trend line that has multiple parallel lines attached to it that act as the extreme borders or breakout levels of the trend analyzed.
- Regression Trend Channel, an automated version of the Trend Channel, based on the regression formula.
- Head & Shoulders Pattern, a drawing tool composed of multiple lines that help you mark head and shoulder patterns on your chart.
Shapes
The Shapes menu offers access to a set of simple and advanced shapes that can be placed on your chart:
- Rectangle & Extended Rectangle, used to create rectangular shapes on your chart, that can also project indefinitely into the past or future data on your chart.
- Ellipse, a shape with similar purposes to the rectangle, but round.
- Objects allow you to mark key points on your chart with various images and icons.
- Pitchforks: Normal, Schiff, and Inside Pitchforks. These are a special type of the Trend Channel but involve a more complex calculation where the original trend line can be at an angle to the trend itself.
- Gann Box and Square tools allow you to draw a set of coordinates on the chart based on Gann proportions.
Fibonacci

These are drawing tools entirely based on Fibonacci proportions, which is one of the oldest market research tools out there. These are offered in a wide range of types:
- Fibonacci Lines offers a set of lines projecting outwards in an arc, with the angles between each of the lines being based on Fibonacci proportions.
- Fibonacci Retracements, along with the extensions, is one of the most common Fibonacci based tools. This plots a set of horizontal lines on your chart, with the distances between those lines being based on Fibonacci numbers.
- Fibonacci Time plots vertical lines, that will help you split up your timestamps based on Fibonacci proportions.
- Fibonacci Wedge allows you to create a segment of a circle, with the chords within that circle being spaced apart based on Fibonacci proportions.
- Trend-Based Fibonacci Extensions – this is a variation of the Fibonacci Retracements, however, acts as an extension of the current trend, being commonly used to project important support/ resistance levels into the future.
- Fibonacci Channel is another type of the trend channel, however the distance between channel borderlines is determined by Fibonacci proportions.
- Fibonacci Circles creates a full out circle/ellipse with radial distances inside it being based on Fibonacci proportions.
- Fibonacci Speed Resistance Arcs is the same as Fibonacci Circles or Wedge, but in this case a proper semi-circle is offered.
- Fibonacci Speed Resistance Fan is a version of the Fibonacci lines, but inscribed in a proper rectangle.
- Trend Based Fibonacci Time is a version of the Fibonacci Time that is based on a past trend line.
- Fibonacci spiral allows you to plot an infinite Fibonacci spiral geometrical shape on the chart.

Pro Tip: Note that all Fibonacci tools offer a very advanced set of settings. Here, you can not only change colors and appearance, but also assign and disable specific Fibonacci levels and even adjust the proportions used for them.
Text Labels
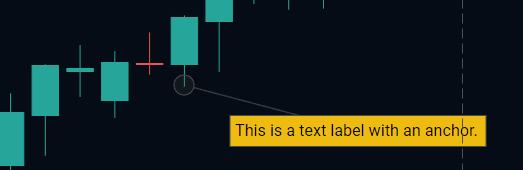
Text tools are only offered in two types – simple text labels, and a text label with anchor points. While the former is just a text label, the latter allows you to point the text label at a specific point on the chart by dragging its anchor point to that location.
Freehand

The Freehand category has two tools:
- Freehand tool for completely freehand drawings. Use this to draw anything on the chart that is not covered by existing drawing tools – arrow, pointers, scribbles.
- The Path tool allows you to create consecutive connected straight lines on the chart, used to highlight the path of a trend or a future chart projection.
Measuring Tool

An extremely useful tool, that allows you to measure distances on the chart, based on three metrics (seen inside the label in the middle of the measuring tool itself).
- #, the number of bars within the measured segment.
- % change of the prices within the measured segment.
- D, the price change within the measured segment as a price change value in points.
The other Measuring Tool that you can add is the Volume Profile drawing tool. When you click on the tool, you will be asked to click on the chart twice to determine a starting point and an end point for the Volume Profile to show. If you click on the Drawing Tool once you've placed it and select the Color Wheel at the top, you will see that you can modify different settings such as:
- The color of the Volume Profile bars
- Background color
- Bar count
- Size %

Bonus: Auto Trend & Resistance
The WealthCharts platform also supports automated trend and resistance analysis.
To enable this, go to the right click menu on a chart, select “Drawing Tools”, select “Auto Trend & Resistance”, and enable either the Trend Lines, or Support and Resistance in there. Once you do this, a lot of lines will be automatically plotted on your chart.
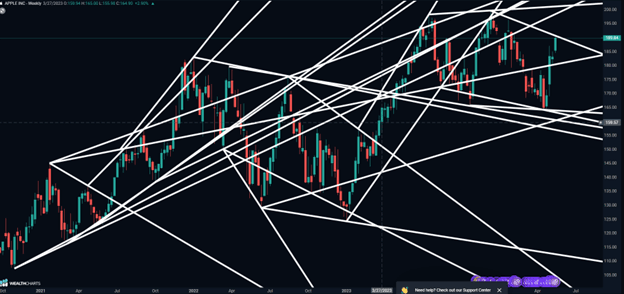
These lines can be selected by clicking on them. Select the lines that you would like to keep on the chart, and then go back to the “Auto Trend & Resistance” menu. Here, click on “Save Selected Lines”. This will disable all of the automated lines that were seen before except for the ones that you have selected to keep on your chart!
