Categories
About UsHow to get startedAccount AccessBrokers and TradingScannersResearch ToolsCommunityStocksOptionsFuturesAlertsMobile AppRight-Click Menu
The right-click menu is one of the most important menus that are available on the trading platform. This is where you would go to adjust almost anything about your chart – ranging from changing some settings or adding an indicator to very specific actions, such as starting a chart replay or opening a data window on the chart. Whenever you find yourself wondering about how to do something to a chart, this is your go-to place – the right-click menu!
Before reading this article, if you are following along on WealthCharts and you do not see all of these options, please be sure to check your zoom levels on your web browser. If you are too far zoomed in, you may not see all of the options in the Right-click menu. Simply zooming out by holding CTRL (or CMD) and then pressing the "-" key will resolve this.
Add Indicators
This is where you would go to place any indicators on your chart. Clicking this button will call up a window with a full list of all indicators that are available to you in the trading platform. This window is split into two areas – on the left are some indicator categories, and on the right are the indicators contained within the category selected. To apply an indicator to the chart, just click on its name, or select the checkboxes next to multiple indicators that you are looking to apply, and click the “Apply” button in the bottom right corner of this window.

Pro Tip: If you’re not sure which category an indicator resides in, try searching for the indicator name using the search menu in the top right corner.
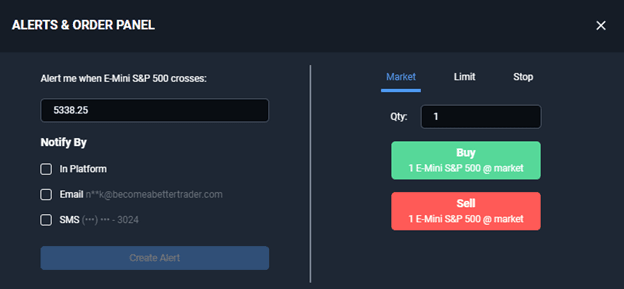
Add Alerts and Order Panel
This button allows you to call up the menu for placing chart price alerts and/or trades right off your charts. Please refer to the articles on these topics where we explain the process in more detail!
Global Chart Settings
This is a menu that allows you to adjust a wider range of chart settings. Note that all of these are global, and will affect all your charts, not just the one that is open currently. Make sure to take a look at the dedicated Global Chart Settings article for a breakdown of all settings available in this menu.
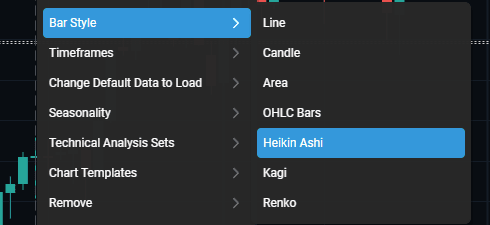
Bar Style
This menu offers a number of various bar styles for your charts.
Timeframes
This menu offers quick access to various timeframe settings for your charts. Just pick a timeframe category here, and then select the timeframe you want to use.

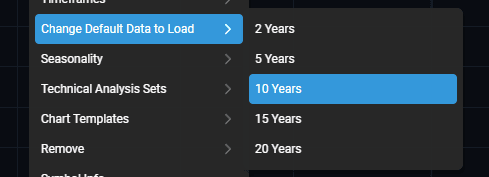
Change Default Data to Load
This menu only applies to charts set to timeframes that are daily and above. Here, you can pick exactly how much data is loaded onto the chart by default when you switch to a different symbol.
Seasonality
Use this menu to enable Seasonality projections on your chart. Several ranges are available here for analyzing seasonality – 5-, 10-, 15- and 20-years’ worth of seasonal data.

Technical Analysis Sets
Here, you can save a set of indicators that is applied to your chart currently as a Technical Analysis set. This is similar to chart templates, however, does not save any chart settings – only indicators.

Chart Templates
This is a very important feature that provides an easy way to save the way your charts are set up and replicate these settings on other charts quickly. Take a look at our detailed article on chart templates for further instructions!

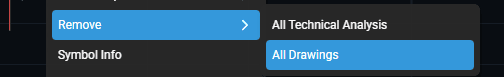
Remove
This menu offers a quick way to remove all indicators, or all drawings off your chart with just single mouse click.
Symbol Info
A handy shortcut for bringing up a window with a full breakdown of various research metrics for the symbol in question – both technical and fundamental. Take a look at our article about the symbol info window for a detailed breakdown of every component available here.

Data Window
This menu option calls up the Data Window, which in turn offers data for bar and indicator values where you point at on the chart.

Refresh Data
This is the button that allows you to recalculate the entire chart and everything on it from scratch, effectively restarting the indicators on it.
Duplicate Chart
This button creates a duplicate copy of your chart, which will have all of the same settings and indicators on it. Please note that using this button will require you to pick a spot for the newly created duplicate chart, just like you do when creating a regular new chart.
Undo/Redo
If you’ve accidentally done something on the chart that you want to backtrack on, this is the button for it. Use Undo to cancel your last actions on the chart and use Redo if you’ve changed your mind about that.
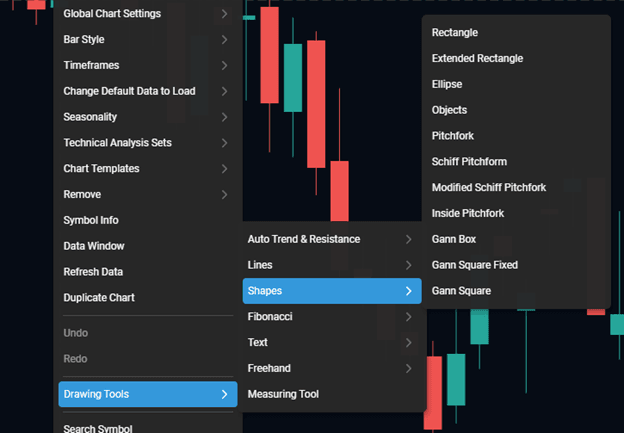
Drawing Tools
The entire set of WealthCharts drawing tools is available to you here. These cover a very wide range of items – make sure to take a look at our article on drawing tools for a detailed description.
Search Symbol
This is another place where you can access the symbol search menu that is necessary when you want to switch the symbol of your chart.

New Chart
This allows you to add a completely new chart to the existing chart grid and is an equivalent of the blue “Add New Chart” button from the toolbar on the left.
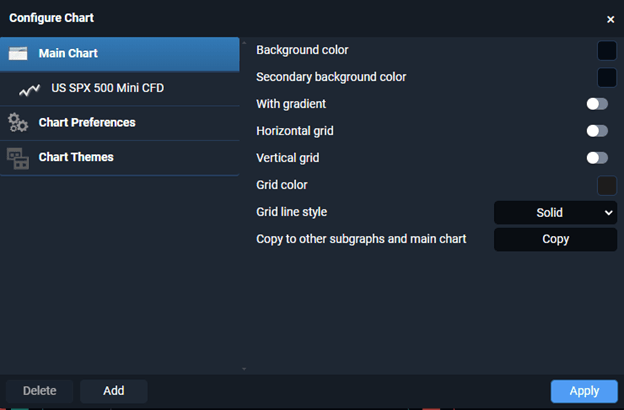
Configure Chart
This menu offers access to all of the chart and indicator settings, and is only available through the right click menu.
Share Chart
This menu allows you to share your chart, either as an image file, or a Wealthought post. Check the Social section for more information about Wealthoughts!

Start/Stop Chart Replay
This allows you to replay the events of the current trading session on your chart. The chart still acts like a regular chart, keeping your indicators and settings, however, offers a way to see what was happening on the chart in retrospect with increased speed.
Watch the video below to learn more: