Categories
About UsHow to get startedAccount AccessBrokers and TradingScannersResearch ToolsCommunityStocksOptionsFuturesAlertsAccumulation/Distribution (A/D) - Indicator Formula
Calculation:
The indicator has 2 types:
Cumulative
AD( t ) = ( V( t ) * ( C( t ) - L( t ) ) - ( H( t ) - C( t ) ) / H( t ) - L( t ) ) + AD( t - 1 )
Standard
AD( t ) = ( V( t ) * C( t ) - O( t ) / H( t ) - L( t ) )
where:
AD( t ) = A/D value on the current day
AD( t - 1 ) = A/D value of the previous day
V( t ) = current day volumes
C( t ) = closure of the current day
H( t ) = maximum of the current day
L( t ) = minimum of the current day
O( t ) = opening of the current day
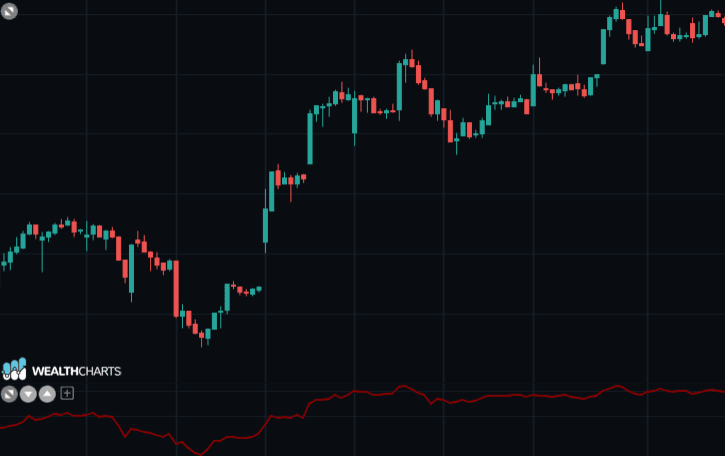
The result which can be obtained is as follows: in the days of accumulation, the prices will be positioned in the upper part of the range, near the maximum (so that the numerator of the fraction will have a positive value) and there will be a good performance of volumes: the A/D will grow and perhaps even significantly.
On the contrary, on distribution days, prices will show a tendency to stagnate downwards, at the lowest levels: volumes in this case will provide a more or less clear measure of the distribution in progress.
If the price of an asset is increasing but A/D is falling, it can be viewed as weakness and signals a potential decline in price.
If the price of an asset is falling but A/D is increasing, it can be viewed as a strength and signals a potential rise in price.