Categories
About UsHow to get startedAccount AccessBrokers and TradingScannersResearch ToolsCommunityStocksOptionsFuturesAlertsBollinger Bands - Indicator Formula
Initially, there were rather rudimentary approaches, consisting of two shifted moving averages (i.e. shifted up or down) of a fixed percentage, usually +/- 4%. Later this technique was perfected by Mark Chaikin, who realized that it was appropriate to use different percentages of displacement, so as to contain within the bands most of the prices recorded and in any case, it was necessary to take into account the different market conditions that arose.
Later on this evolution was carried out by John Bollinger, linking the width of the bands directly to the volatility and particularly to a precise measurement of it, the standard deviation> (or square average deviation) which is a statistical measure of the variability of a historical series, obtained from the square root of a particular measure of the dispersion of values around a characteristic value (square root of the variance).
Therefore, the variance is the sum of the squares of the differences of each value of a historical series, with respect to the average value (x), compared to the number of values making up the series; the standard deviation, on the other hand, is the square root of the variance.
In this way you have a tool that automatically changes with changing market conditions, thus meeting the need to capture the variables that have made the fortune of the fundamental approach and transfer them to the technical approach (think, for example, of the changes that certain trading systems undergo as interest rates change).
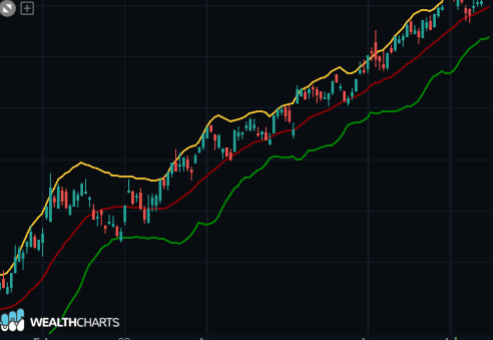
When the bands come in close together it signals a current low period of volatility but is considered a potential sign for future increased volatility.
When the bands are wider apart, there is a higher chance of decreased volatility.