Categories
About UsHow to get startedAccount AccessBrokers and TradingScannersResearch ToolsCommunityStocksOptionsFuturesAlertsMobile AppCandle Count - Indicator Formula
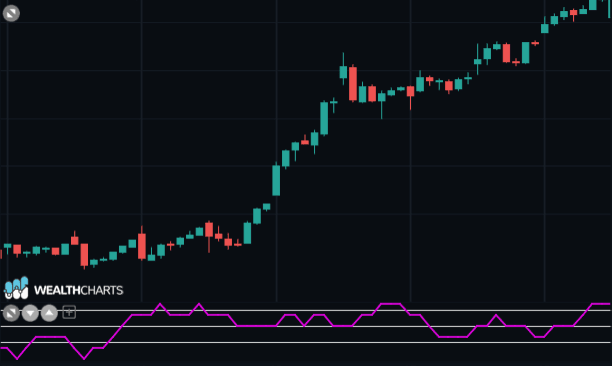
The indicator determines the difference between positive and negative candles in a default period of 15 days, (which can be modified) then divided by the number of days (15) and multiplied by 100 to obtain a scale from -100 to 100.
The Candle Counter aims to identify those areas where the trend shows signs of exhaustion. Usually, two ranges are created based on the historical trend (maximums and minimums prior to the current phase), one that contains the intermediate turning points of the past trend, the other on which the reversals are placed. Exceeding the first line activates an early warning condition. Reaching extreme areas is an important alert signal. The indicator is also used as a complementary tool in Elliott's wave count, since it often indicates the end of the impulsive wave: for example, the attainment of new price peaks when the indicator has already reached the top indicates that the current one is probably a correction phase and not the continuation of the impulsive series.