Categories
About UsHow to get startedAccount AccessBrokers and TradingScannersResearch ToolsCommunityStocksOptionsFuturesAlertsChande Kroll Stop - Indicator Formula
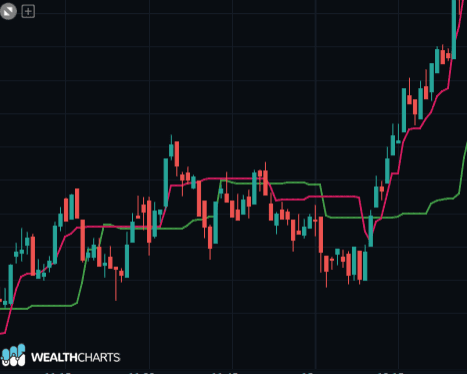
Chande Kroll Stop is an indicator that follows trends using a variation on directional movement. Traders and investors use this indicator help identify a stop loss for long/short positions. The indicator has charts two lines: Some traders buy when price crosses above both lines or sell when price crosses below both lines. For the best results, the Chande Kroll Stop should be used in direction with the trend.
Calculation:
Chande Kroll Stop is derived using the average true range of an assets volatility.
(Current bar High-Current bar Low)
(Current bar High-Previous bar close)
(Current bar Low-Previous bar close).