Categories
About UsHow to get startedAccount AccessBrokers and TradingScannersResearch ToolsCommunityStocksOptionsFuturesAlertsChande Trendscore - Indicator Formula
Markets are traditionally distinguished, for operational purposes, in trending markets and trading markets: in the former there is an immediate perception, even visually, of a well-defined trend, a trend that will end when there is clear evidence - Dow teaches - of the beginning of a new trend in the opposite direction.
Trading markets, on the other hand, are typically characterized by an undefined price pattern and by almost causal fluctuations.
Both are not very suitable for trading, marked as they are by a convulsive pattern, which would make the most tried and trust trading system go over the edge.
With regard to the above, Tushar Chande has recently developed an interesting and simple indicator, the Trendscore, which aims to indicate precisely when the market - or the stock followed - is in the "trending" or "trading" phase.
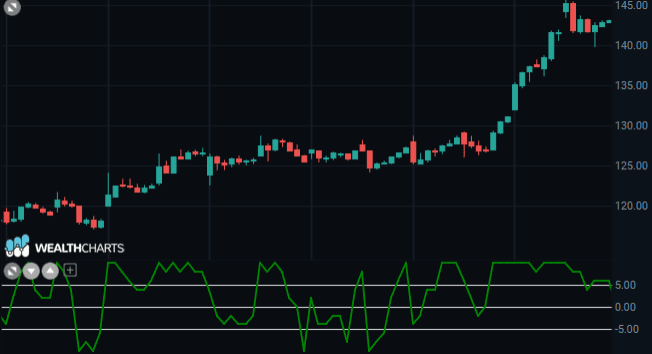
This indicator offers to indicate both the direction of the trend and its strength through a scale that varies from -10 to +10.
The logic behind its structure is very simple: we start, in fact, from the comparison between the closure of today and that of n days ago: if the first is greater than or equal to the second, we mark a point, otherwise we mark -1.
Then we compare today's closure with that of n + 1 day ago: similarly to what we saw earlier, we will add another point if today's closure is no less than that of n + 1 day ago, -1 if it is not.
The process will continue until you have done all comparisons from 11 to 20 days ago; the Trendscore will then vary from -10 to +10: if today's closure is higher than all previous closures, the Trendscore will mark more than ten; if today's closure is lower than all previous closures, the Trendscore will be at -10.
It is evident at this point that the Trendscore can be defined as the sum (at 10 days) of all the "scores" from 11 to 20 days ago, as well as it is clear that you can consider a period of time more or less long, depending on your operational sensitivity and the trend underlying the stock in question.
The indicator fluctuates between -10 and +10. A reading of +10 implies that a strong bullish trend is in progress. A reading of -10 implies that a strong bearish trend is in progress.