Categories
About UsHow to get startedAccount AccessBrokers and TradingScannersResearch ToolsCommunityStocksOptionsFuturesAlertsMobile AppCommodity Channel Index (CCI) - Indicator Formula
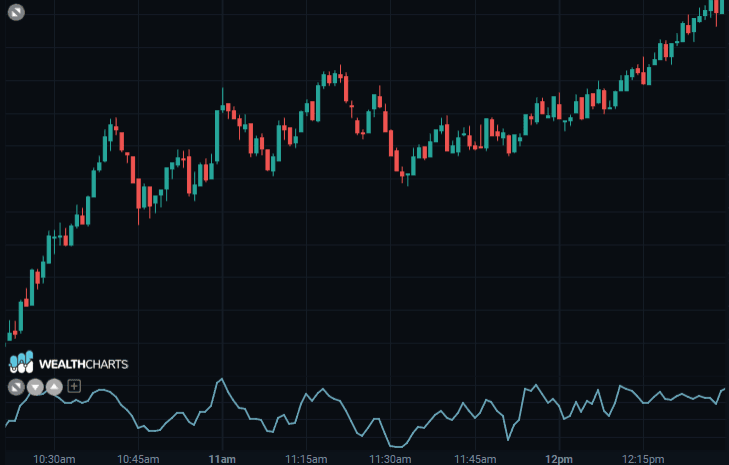
The CCI is an indicator developed by Donal Lambert for futures markets (particularly for commodities) to seek to exploit their cyclical characteristics, but it is also good for equity and bond markets.
The formula on which it is based includes some innovative elements, which have helped to make the CCI a truly original indicator:
It takes into account the volatility, represented by the standard deviation;
the data considered in the calculation is not the simple closing price, but the typical price, obtained by dividing the sum of the minimum, the maximum and the closing by 3: in this way a data presumably more significant than the last price recorded is used;
Although its nature is not that of a threshold indicator (i.e. an indicator that moves within predefined ranges, similarly to what occurs for RSI or Stochastic), Lambert introduced it to these terms, using a constant in the calculation, which was equal to 0.015, where the indicator remains confined within the range -100 / +100 for 70 - 80% of the time.
For simplicity, we have broken the formula in several steps.
Calculation of the current average price M( t ) :
M( t ) =H( t ) + L( t ) + C( t ) / 3
MM( t ) = average of the values between M( t ) and M( t - NP )
Calculation of the deviation D( t ) :
D( t ) = ( ABS( M( t ) - MM( t ) ) + ABS( M( t - 1 ) - MM( t ) ) + .....
... + ABS( M( t - NP ) - MM( t ) ) ) / NP
Calculation of the final indicator CCI( t ) :
CCI( t ) = M( t ) - MM( t ) / 0.015 * D( t )
where:
H( t ) = the maximum price of the day t
L( t ) = the minimum price of the day t
C( t ) = the closing of the day t
M( t ) = average daily price t
NP = number of indicator calculation periods
MM( t ) = simple moving average at NP of the reference prices
ABS( ) = function that restores the absolute value;
The modalities of use of the CCI proposed by Lambert were as follows:
use a time amplitude equal to one third of the cycle dominating the stock;
The operating signals are provided by the crossing of the extreme ranges: long positions will be opened when the CCI exceeds +100, to close them when the CCI returns within the typical range of oscillation; short positions will be taken when the CCI breaks down -100, to close them when the indicator exceeds the above-mentioned level from below;
No operation is undertaken when the CCI "fluctuates " between -100 and +100.
When the CCI goes from negative or zero readings to positive readings heading towards +100, can be viewed as a signal to watch for an emerging uptrend.
When the CCI goes from positive or zero readings to negative readings heading towards -100, can be viewed as a signal to watch for an emerging downtrend.