Categories
About UsHow to get startedAccount AccessBrokers and TradingScannersResearch ToolsCommunityStocksOptionsFuturesAlertsCoppock Curve - Indicator Formula
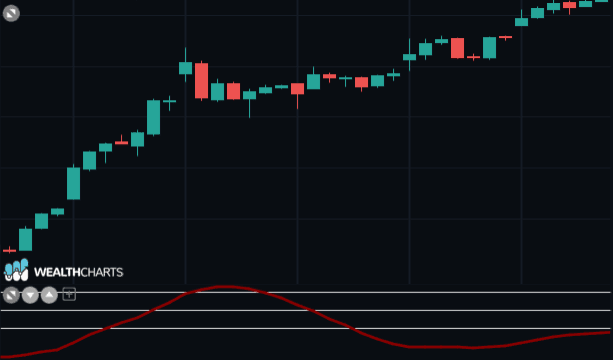
The Coppock Curve was developed by E.S.C. Coppock, the founder of Trendex Research in San Antonio, Texas. The Coppock Curve is an indicator for long-term investors and generally helps with market moves between 6 weeks and 12 months. The indicator was developed for use on a monthly time frame chart.
If the Coppock Curve has a reading above the zero line, the asset is considered to be bullish.
If the Coppock Curve has a reading below the zero line, the asset is considered to be bearish.
Calculation:
The indicator takes the 14-month rate of change and the 11-month rate of change adds them together and then is smoothed out by a 10-period weighted moving average (WMA).
Coppock Curve = WMA[ 10 ]( ROC[ 14 ] + ROC[ 11 ] )