Categories
About UsHow to get startedAccount AccessBrokers and TradingScannersResearch ToolsCommunityStocksOptionsFuturesAlertsCyclical-Track - Indicator Formula
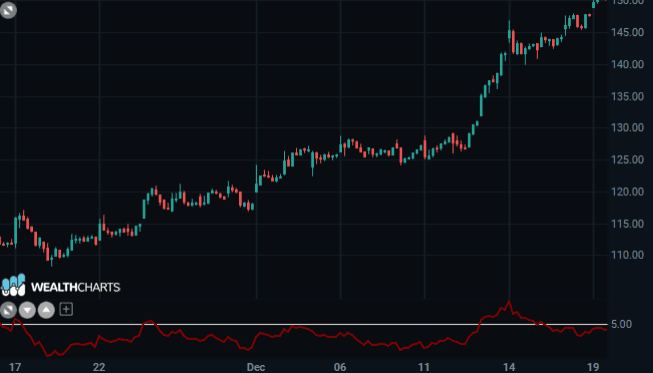
It is the difference between the price and your moving average. The curve oscillates around zero indicating the Price Distance from the average.
The simplicity of the indicator does not affect its use as a compendium tool for determining the turning points of the trend, albeit with some modifications.
The concept shows the difference between the closing time and the moving average of X days.
Initially, when the indicator is above the Zero-Line, or positive, this represents an uptrend or a bullish opportunity. However if the price gets too far away from Moving Average the instrument could be due for a retracement.
Initially, when the indicator is below the Zero-Line, or negative, this represents a downtrend or a bearish opportunity. However if the price gets too far away from Moving Average the instrument could be due for a retracement.