Categories
About UsHow to get startedAccount AccessBrokers and TradingScannersResearch ToolsCommunityStocksOptionsFuturesAlertsExponential Moving Average (EMA) - Indicator Formula
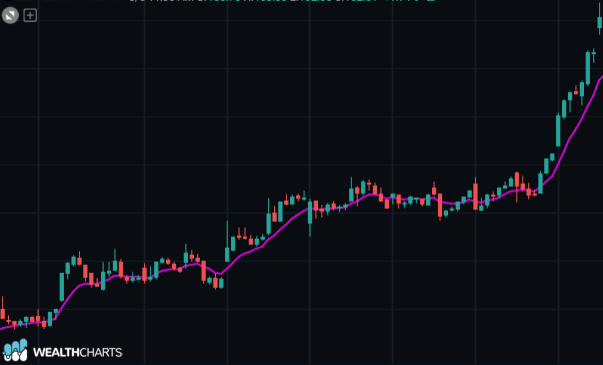
This indicator is useful especially for those stocks that have a typically very uneven trend (which go quickly from high peaks to discrete falls) in fact, to level out as much as possible the differences according to the so-called technique of "exponential smoothing".
The indicator, calculated in this way, represents the trend of the stock in the form of a soft oscillatory curve, with the intention of revealing an underlying movement not clearly visible by observing the simple chart of the stock with very "ervous" movements.
EMA( t ) = K * ( P( t ) - ES( t - 1 ) ) + ES( t - 1 )
where:
EMA( t ) = Calculation of the Exponential Moving Average at the current day
EMA( t - 1 ) = calculation of the Exponential Moving Average of the previous day
K = constant, equal to 2 / ( NP + 1 )
NP = number of periods for the calculation of the indicator
P( t ) = the price or value of the reference index at the current time
Prices moving above the Moving Average are seen as positive or could begin a bullish move, while prices moving below the moving average are seen as negative or could be beginning a bearish move.