Categories
About UsHow to get startedAccount AccessBrokers and TradingScannersResearch ToolsCommunityStocksOptionsFuturesAlertsFisher Transform - Indicator Formula
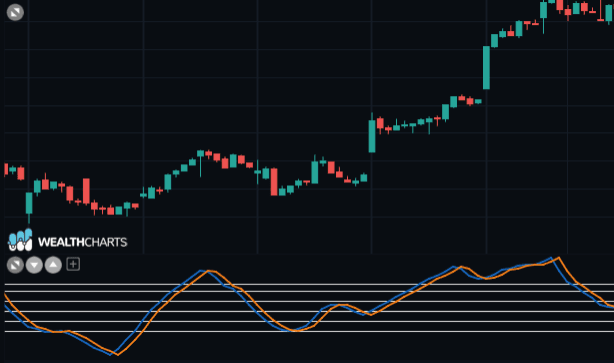
The Fisher Transform was developed by J.F. Ehlers. The Fisher Transform enables traders change price into a Gaussian normal distribution. Traders and investors use this indicator to help identify overbought and oversold levels within a certain asset. It can also be used to help determine potential reversal points within an asset. The Fisher Transform is often used by traders as a leading indicator not a lagging indicator.
The Fisher Transform-derived values fluctuate above and below a zero line on a scale between -1 and 1.
When Fisher Transform is above the Zero-Line, or positive, this represents a bullish opportunity.
When Fisher Transform is below the Zero-Line, or negative, this represents a bearish opportunity.
Calculation:
Fisher Transform = 0.5 * ln (1 + X / 1 + X )
ln = natural logarithm
X = transformation of price to a level between -1 and 1