Categories
About UsHow to get startedAccount AccessBrokers and TradingScannersResearch ToolsCommunityStocksOptionsFuturesAlertsHigh-Low Envelope - Indicator Formula
This indicator was presented by Greg Morris in 1994, which correlates the daily (high-low) range with the percentage change in prices.
The original formula precisely predicts the product of these two factors, but one would thus obtain an exasperatingly rapid curve, with frequent zero crossings.
It was preferred to smooth the trend with a moving average, reviewing the background setting.
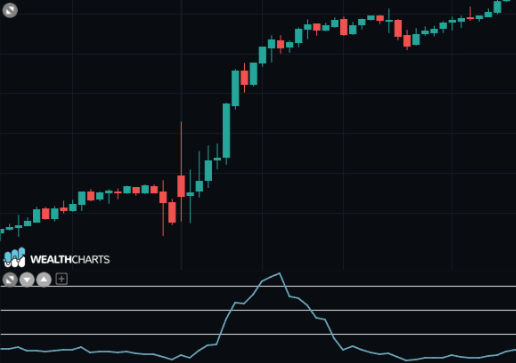
The indicator shows the strong market position.
When the price reaches or crosses the upper band, a sell signal is given and when the price reaches or crosses the lower band of an envelope channel a buy signal occurs.