Categories
About UsHow to get startedAccount AccessBrokers and TradingScannersResearch ToolsCommunityStocksOptionsFuturesAlertsMobile AppHighs and Lows - Indicator Formula
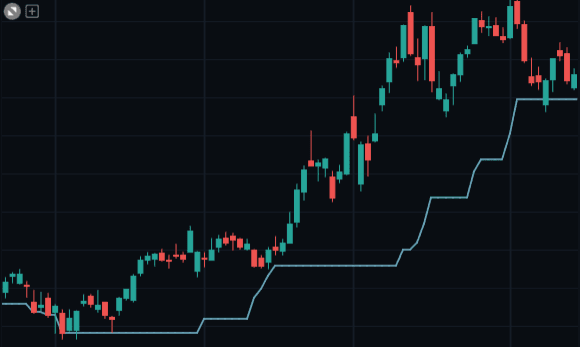
The "Highs and lows" indicator has the function of highlighting the variations on the lows and/or highs that the stock is testing.
For example, setting the indicator to 20 days (by default), calculated on the low values, will draw a segmented curve that takes into account the time x set and detects the absolute low verified in that time and space.
Upon each added day, one day will be removed from the start of the calculation, thus progressing in time and indicating the new low.
This type of calculation requires that the calculated lows remain unchanged, then a small horizontal line is drawn, until a new low is reached, which may be higher than the previous one, in the case of an increasing trend or lower than the previous one, in the case of a decreasing trend.
At this point, we can assume that the "Highs and lows" indicator facilitates the recognition of the trend and the low (or high) of the period.
Moreover, thanks to this indicator you can easily notice when a stock comes out of a period of stagnation, entering a new trend: in fact, the longer the period of horizontal movement, the wider the would be the "scales" drawn by the indicator.