Categories
About UsHow to get startedAccount AccessBrokers and TradingScannersResearch ToolsCommunityStocksOptionsFuturesAlertsIntraday Intensity - Indicator Formula
Intraday Intensity is an indicator designed by David Bostian that aims to measure, by means of volumes, the flow of money in or out of a financial instrument.
Unlike the more popular On Balance Volume, where the whole volume is added or subtracted to a cumulative sum of volumes as a function of a bullish or bearish closure, Intraday Intensity only takes into account a portion of volumes as a function of the position of the closure within the range between maximum and minimum.
The logic of operation is based on the assumption that a preponderance of buyer forces will push the closure very close to the maximums, the volumes in this case will be mainly due to purchases. Conversely, in the case of a prevalence of sellers, the closure is likely to be close to the day's lows and volumes will mainly be determined by sales.
You can build two types of Intraday Intensity, standard or normalized. The standard version consists of a summation for a number of periods, usually 21, of the formula:
II = ( 2 * C ) - H - L / H - L * V
where:
C = Current bar Close
H = Current bar High
L = Current bar Low
V = Current bar Volume
The standard version divides the standard indicator formula by the sum of the volumes for the same number of periods and multiplies the result by 100.
The result is an indicator that moves up or down through the zero equilibrium line and whose direction determines a greater presence of forces in buying or selling.
You can display Intraday Intensity on a stock or index, by selecting the appropriate entry from the list of indicators, the usual dialog box to set the parameters will appear.
You can choose the calculation formula, standard or normalized, and whether to use the volumes or the traded equivalent. You can also set the number of periods over which the calculation is performed, this parameter can be chosen between 1 to 999.
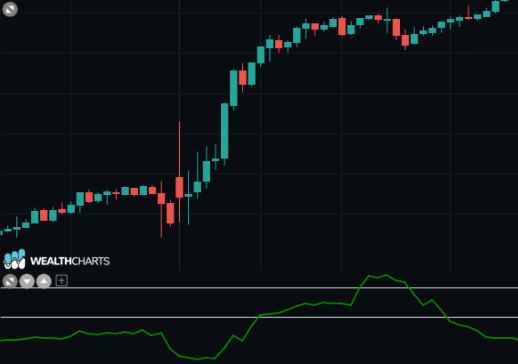
The Intraday Intensity indicator can be displayed below prices as a linear chart or histogram.
Prices moving above the zero-line are seen as positive or could begin a bullish move, while prices moving below the zero-line are seen as negative or could be beginning a bearish move.