Categories
About UsHow to get startedAccount AccessBrokers and TradingScannersResearch ToolsCommunityStocksOptionsFuturesAlertsIntraday Momentum (IMI) - Indicator Formula
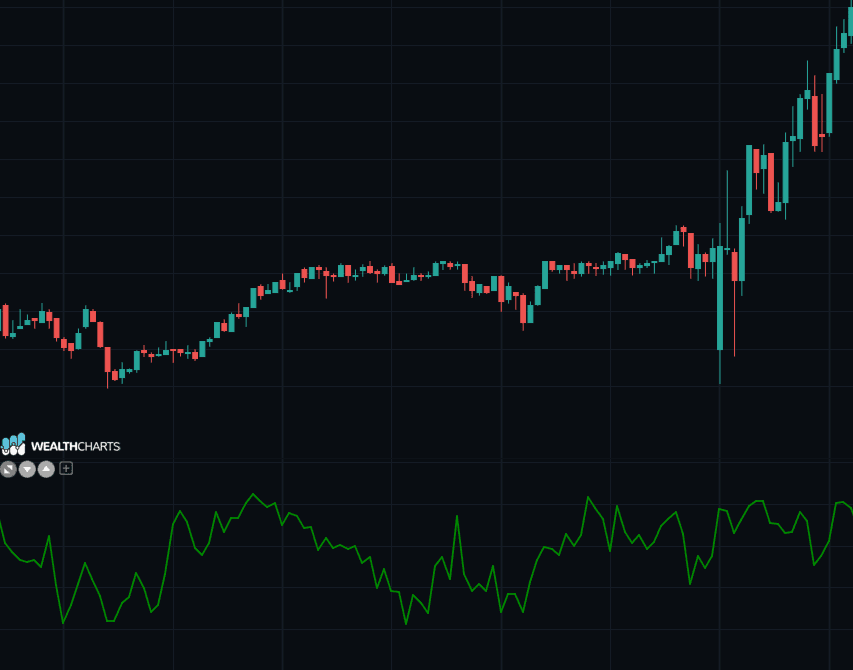
The purpose of this indicator is to analyze the nature of the candles that form on the charts.
The IMI has a structure very similar to RSI: it differs from it in that it takes into account not the difference between today's closure and the closure of the previous day (interday momentum), but the difference between today's closure and opening (intraDay momentum), i.e. the length and colour of the real body that identifies the session. For the rest, the RSI and IMI are identical.
Therefore by setting the:
IMI-UP = sum of n intraday periods, positive momentum
IMI-DOWN = sum of n intraday periods, negative momentum
We will have:
IMI = IMI-UP / IMI-UP + IMI-DOWN * 100
In other words, if we want to calculate a 14-year IMI, we will have to consider, over the last 14 periods, the days on which the stock closed upwards in comparison to its opening ( IMI-UP ) and compare this sum to the denominator of the sum of IMI-UP and IMI-DOWN.
When an asset’s price is reading above 70, this represents a potential bearish opportunity or identifying that the uptrend trend could be ending.
When an asset’s price is reading below 30, this represents a potential bullish opportunity or identifying that the downtrend could be ending.