Categories
About UsHow to get startedAccount AccessBrokers and TradingScannersResearch ToolsCommunityStocksOptionsFuturesAlertsKlinger Oscillator - Indicator Formula
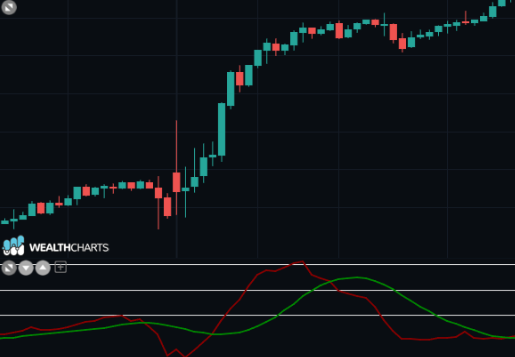
The Klinger volume oscillator was developed by Stephen Klinger to help determine price reversals within a particular asset by comparing volume and price. The Klinger volume oscillator also helps determine the long term trend of money flow within an asset. The Klinger volume oscillator is dependent on "volume force" a term that is solely for this indicator. The volume force uses trend and volume to determine its calculation. Often times traders and investors chart the indicator with a 13-period Exponential Moving Average.
When the 13-period EMA is above the Klinger volume oscillator, this represents a bullish opportunity.
When the 13-period EMA is below the Klinger volume oscillator, this represents a bearish opportunity.