Categories
About UsHow to get startedAccount AccessBrokers and TradingScannersResearch ToolsCommunityStocksOptionsFuturesAlertsMobile AppMomentum - Indicator Formula
Basically, it is understood as the measure of the degree of acceleration that a price movement, whether downward or upward, represents during its evolution; one can also speak of the intrinsic strength of the movement.
The possibility of having this kind of information from the indicators is very important and can be very useful in situations where a trend reversal is close.
If we want to convert what is expressed in words into a formula, the value of the indicator, for example, with an amplitude of 10 days, is expressed in terms of the difference between the price observed at time t and the price recorded at time t - 10.
The function thus obtained is compared with a horizontal line representing null values.
Here in the formula, the differential momentum:
M( t ) = P( t ) - P( t - NP )
The chart also supports some variants, such as the momentum rate
M( t ) =P( t ) / P( t - NP )
and the momentum percentage::
M( t ) = 100 *
P( t ) - P( t - NP ) / P( t - NP )
where:
NP = Number of indicator periods
M( t ) = Momentum of the current day
P( t ) = the price or value of the reference index on the current day
P( t - NP ) = price or value of the reference index at time t - NP
The typical information that a momentum based on the evolution of a price provides is as follows:
1) momentum values > 0 indicate an expansive phase of the price. However, we can distinguish two different situations related to positive signs of the momentum (Mo).
1a) increasing Mo values indicate a strengthening of the current expansion.
The expansive phase is likely to be particularly intense.
1b) decreasing Mo values indicate a weakening of the expansive phase. As it approaches its peak, the expansive phase records decreasing price increases, so you can see a slowdown in the speed of the rising price. In such a situation, the upward trend is likely to be interrupted in a short period of time.
2) momentum values < 0 indicate a bearish phase of the price movement. Even in this instance, two different cases may occur, which are mirrored in point 1.
2a) decreasing Mo value indicate a high degree of reduction in the price of the object of interest.
2b) increasing Mo values indicate a weakening of the bearish phase. The price decreases show a decreaseas the "bottom" of its trend approaches. The speed of the descent loses its intensity, promptly signaled by the Mo.
The operational indications in the original version are:
buy (long position) when the momentum is above the 100 threshold with an upward trend (strengthening expansion );
liquidate long positions in conjunction with momentum trends above the 100 threshold, but decreasing (weakening expansion),
sell (short position) when the momentum falls below the 100 threshold ( strengthening reductions );
liquidate short positions with increasing momentum below the 100 threshold (weakening reductions).
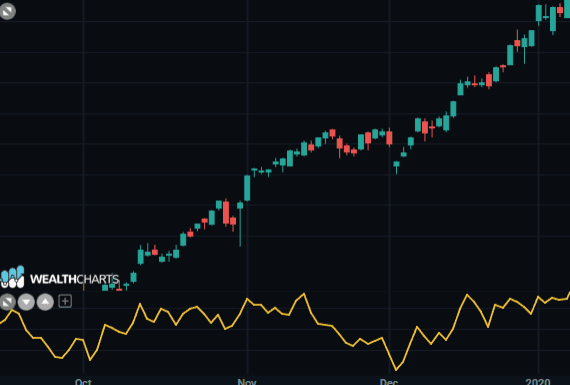
When Momentum is above the Zero-Line, or positive, this represents an uptrend or a bullish opportunity.
When Momentum is below the Zero-Line, or negative, this represents a downtrend or a bearish opportunity.