Categories
About UsHow to get startedAccount AccessBrokers and TradingScannersResearch ToolsCommunityStocksOptionsFuturesAlertsMoney Flow Index (MFI) - Indicator Formula
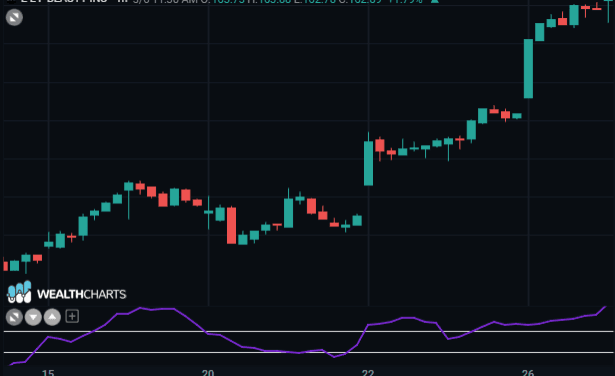
The "Money Flow Index" indicator measures the strength of a stock's cash flow.
It is linked to RSI, but the MFI only analyzes the volume action while RSI only incorporates the share price.
The cash flow, (not the MFI), is calculated by determining the average price ( PM ) of the day and then by comparing this value to the average price of the previous day.
There are two versions for the calculation of this indicator:
PM( t ) = L( t ) + H( t ) + O( t ) + C( t ) / 4
or setting the third parameter to 0 gives you the formula:
PM( t ) = L( t ) + H( t ) + C( t ) / 3
where:
PM( t ) = average price on the current day
L( t ) = minimum value of the current day
H( t ) = maximum value of the current day
O( t ) = opening of the current day
C( t ) = closing of the current day
The money flow for a specific day is calculated by multiplying the average price by volume.
MF( t ) = V( t ) * PM( t )
where:
MF( t ) = current Money Flow
V( t ) = current Volume
PM( t ) = average price of the current day
If today's average price PM( t ) is higher than yesterday's average price PM( t - 1 ) shall be considered as a positive cash flow.
If today's average price PM( t ) is lower than yesterday's average price PM( t - 1 ) , is considered a negative money flow.
Positive Money Flow (PMF) is the sum of the positive cash flow above the specified number of periods.
Negative Money Flow (NMF) is the sum of the negative cash flow over a specified number of periods.
MR( t ) = PMF( t ) / NMF( t )
where:
MR( t ) = current Money Ratio
PMF( t ) = current Positive Money Flow
NMF( t ) = current Negative Money Flow
Finally, the MFI is calculated by using the following formula:
MFI( t ) = 100 - 100 / 1 + MR( t )
The interpretation of the MFI is as follows:
When the Money flow index is reading above 80, this represents a potential bearish opportunity or identifying that the uptrend trend could be ending.
When the Money flow index is reading below 20, this represents a potential bullish opportunity or identifying that the downtrend could be ending.
Traders also use the Money flow index to find divergences. Where the price makes a higher high, while the Money Flow Index makes a lower high.