Categories
About UsHow to get startedAccount AccessBrokers and TradingScannersResearch ToolsCommunityStocksOptionsFuturesAlertsPrice Oscillator (DOA) - Indicator Formula
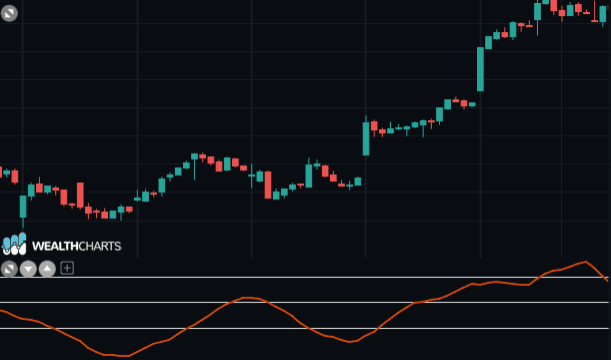
This indicator is constructed by calculating the difference between a short moving average and a longer period one.
DOA = MMB - MML
where:
MMB = short-term moving average
MML = long-term moving average
At this point, the buying condition occurs when the doa is greater than zero, while the selling condition occurs when it is less than zero.
At the end, we can say that this is a trend indicator that provides optimal signals when the underlying stock is characterized by a well-defined trend.
The reasons for building the Moving Average indicator are:
Identify the differences between the two moving averages.
Note interesting deviations caused by the divergence between the long-term and short-term moving average.
Making the meeting points of the two moving averages more easily identifiable: in fact, when the oscillator crosses the zero line, it means that the two moving averages have crossed each other, since the distance between the two moving averages is zero at that moment.
When the Price Oscillator is above the Zero-Line, or positive, this represents an uptrend or a bullish opportunity.
When the Price Oscillator is below the Zero-Line, or negative, this represents a downtrend or a bearish opportunity.