Categories
About UsHow to get startedAccount AccessBrokers and TradingScannersResearch ToolsCommunityStocksOptionsFuturesAlertsRelative Strength Index (RSI) - Indicator Formula
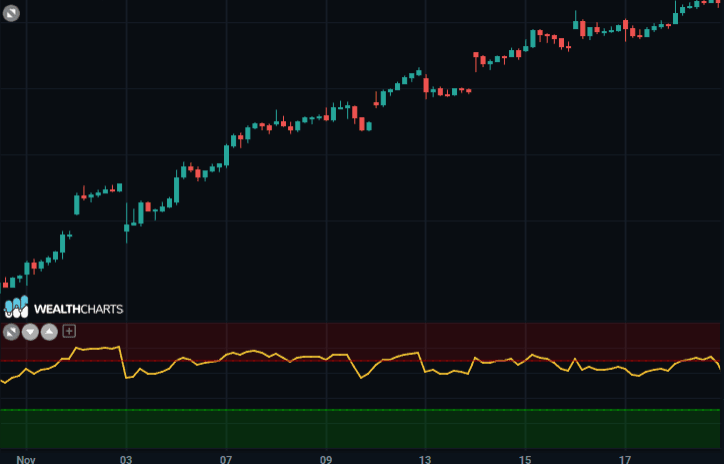
It is a very popular indicator presented by John Welles Wilder jr., its purpose is to measure the momentum of a stock or the speed of price movements.
With reference to the above, the facilitation lies in its reading scale, in fact, as a threshold crossing indicator, it oscillates between predefined values, i.e. 0 and 100 and this facilitates the reading and comparison between the different stocks.
Typically, the chart is crossed by lines that delimit the typical oscillation band, passing respectively through 30 and 70: the R.S.I. which will be highlighted on the chart will be said to be overbought when it positions itself above 70 points and oversold when it positions itself below 30 points.
The formulation of the standard indicator is as follows:
RSI( t ) = 100 - 100 / (1 + ( POS( NP ) - NEG( NP ) ))
where:
RSI( t ) = indicator value at time t
NP = number of indicator periods
For the calculation of the Simple RSI:
POS ( NP ) = the average of the positive changes in the stock price over the period NP
NEG ( NP ) = the average of negative changes in the price of the stock over the period NP
For the calculation of the Blended RSI:
POS( NP ) = the sum of the positive changes in the stock price during the period NP
NEG( NP ) = the average of negative changes in the price of the stock over the period NP
For the calculation of the Straight RSI:
POS( NP ) = the number of positive changes in the price of the stock over the period NP
NEG( NP ) = the number of negative changes in the price of the stock over the period NP