Categories
About UsHow to get startedAccount AccessBrokers and TradingScannersResearch ToolsCommunityStocksOptionsFuturesAlertsMobile AppRsi3M3 Indicator - Indicator Formula
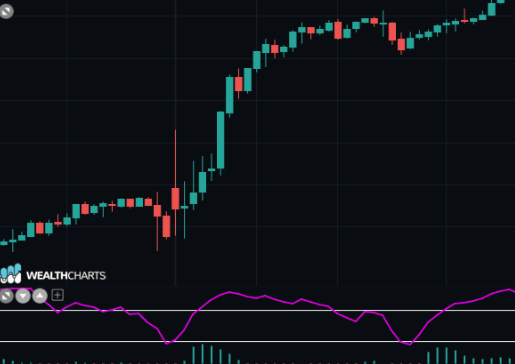
The Rsi3M3 indicator was developed by a gentleman named Walter Bressert. He used applied a three-day RSI smoothed by a three-day moving average to develop the Rsi3M3 indicator. The indicator has values that range from 0-100, with above 70 being viewed as overbought and below 30 is viewed as oversold. If the indicator is reading above .50 or 50, then the market could be signaling an upward trend. Conversely, if the indicator is reading below .50 or 50, then this could be taken as signaling a downward trend.
When an asset's price is reading above 70, this represents a potential bearish opportunity or identifying that the uptrend trend could be ending.
When an asset's price is reading below 30, this represents a potential bullish opportunity or identifying that the downtrend could be ending.
Calculation:
RSI3M3 = Average( RSI( Price, RSIPeriod ), SmoothPeriod )
RSI3M3Detrend = RSI3M3 - Average( RSI3M3, DetrendPeriod )
