Categories
About UsHow to get startedAccount AccessBrokers and TradingScannersResearch ToolsCommunityStocksOptionsFuturesAlertsSMI Ergodic Indicator - Indicator Formula
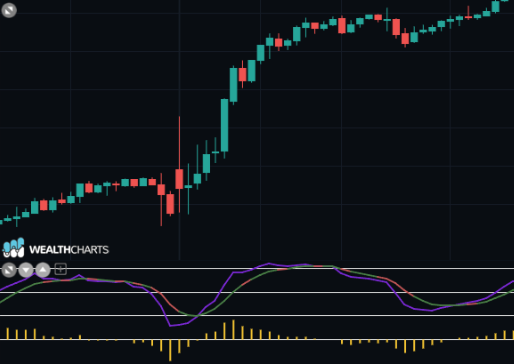
SMI Ergodic indicator uses the True Strength Index, which was developed by William Blau, in its calculation.
SMI Ergodic indicator moves around a signal line rather than the market price which is usually an exponential moving average.
When an asset’s price is above the signal line, this represents a bullish opportunity.
When an asset’s price is below the signal line, this represents a bearish opportunity.
Calculation:
ERGODIC = TSI
ERGODIC Signal Line = EMA( TSI )
ERGODIC Oscillator = TSI - EMA( TSI )
By default, TSI is setup with a Short Term of 5 and a Long Term of 20 and a 5-period EMA.
SMI Ergodic Oscillator
The SMI Ergodic Oscillator uses the SMI Ergodic Indicator and it is usually displayed above or below a price chart.
SMI Ergodic Oscillator plots the difference between the SMI Ergodic indicator and the signal line onto a histogram. The signal line, which is an Exponential Moving Average (EMA) of the SMI, is subtracted from the SMI to create the SMI Ergodic Oscillator. The trader can adjust the inputs and period lengths to their personal liking if need be.
When the SMI Ergodic Oscillator is above the Zero-Line, or positive, this represents a bullish opportunity.
When the SMI Ergodic Oscillator is below the Zero-Line, or negative, this represents a bearish opportunity.
