Categories
About UsHow to get startedAccount AccessBrokers and TradingScannersResearch ToolsCommunityStocksOptionsFuturesAlertsStochastic RSI - Indicator Formula
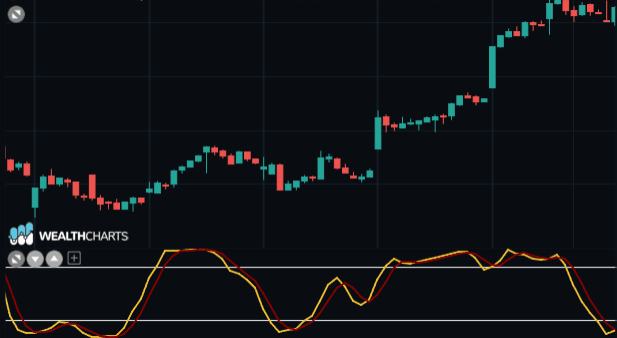
The Stochastic RSI was first invented by Tushar S. Chande and Stanley Kroll and was released to the public in the mid-1990s. The Stochastic RSI provides a stochastic calculation of the RSI indicator. The indicator can also be used by some traders to identify when a market may be trending. If the indicator is reading above .50 or 50, then the market could be signaling an upward trend. Conversely, if the indicator is reading below .50 or 50, then this could be taken as signaling a downward trend. It generally takes the information from the last 14 trading days.
Traditional RSI settings are set at 70 being overbought and 30 being oversold. Because the Stochastic RSI is an indicator of an indicator, (RSI is the first step behind price, then Stochastic RSI would be the second step) the Stochastic RSI uses more extreme readings:
When an asset’s price is reading above 80, this represents a potential bearish opportunity or identifying that the uptrend trend could be ending.
When an asset’s price is reading below 20, this represents a potential bullish opportunity or identifying that the downtrend could be ending.
Calculation:
Stoch RSI = RSI - Lowest Low RSI / Highest High RSI - Lowest Low RSI