Categories
About UsHow to get startedAccount AccessBrokers and TradingScannersResearch ToolsCommunityStocksOptionsFuturesAlertsMobile AppStoller Average Range Channel Bands (STARC Bands) - Indicator Formula
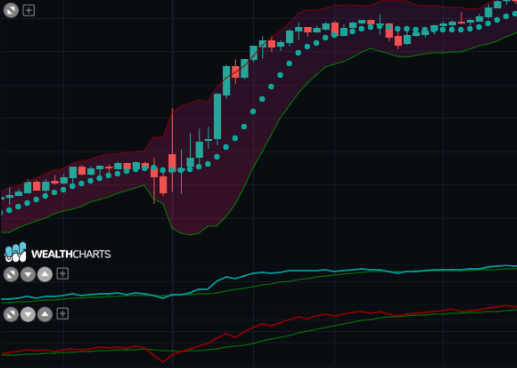
Manning Stoller developed the STARC Bands, which are two bands that are placed above and below a simple moving average. The SMA length is usually between five and ten periods. The channel that is created by the bands can help traders determine when to buy or sell. When the upper or lower bands are breached it can signal a change in trend.
If prices are rising, the trader wants to buy (go long) near the lower band and sell near the upper band.
If prices are falling, the trader wants to sell (go short) near the upper band and buy (short cover) near the lower band.
If prices are range-bound or choppy the same rules still apply: traders should buy against the lower band and sell against the upper band.
Formula:
STARC Band+ = SMA + ( Multiplier x ATR )
STARC Band- = SMA - ( Multiplier x ATR )
Where:
SMA = Simple moving average, with length typically between 5 and 10 periods;
ATR = Average True Range;
Multiplier = Factor to apply to ATR: 2 is common but can be adjusted for personal preference;
Calculation:
Choose an SMA length. 5 to 10 periods is common for STARC Bands.
Choose an ATR multiple. Two times ATR is common, although this can be adjusted as needed.
Calculate the SMA.
Calculate the ATR, and then multiply it by the multiple chosen.
Add the ATR x multiple to the SMA to get STARC Band+.
Subtract the ATR x multiple to the SMA to get STARC Band-.
Calculate the new values as each period ends.