Categories
About UsHow to get startedAccount AccessBrokers and TradingScannersResearch ToolsCommunityStocksOptionsFuturesAlertsMobile AppStop and Reverse Point (SAR) - Indicator Formula
The parabolic system is a mathematical model that correlates time with price. The objective of this indicator is to identify the point of eventual inversion of the current trend.
The philosophy of the parabolic system is that time is an enemy. In this sense, when following this indicator you are always on the market: once a position is no longer advantageous, according to the indicator, it is reversed not simply closed.
The reversal point is referred to as the Stop and Revers Point (SAR) and is calculated using the following method:
SAR( t ) = SAR( t - 1 ) + FA * ( Pz( t ) - SAR( t - 1 ) )
where:
SAR( t ) = current point of reversal
SAR( t - 1 ) = SAR of the previous period
FA = acceleration factor
Pz( t ) = current price considered significant
This is the trend following system par excellence.
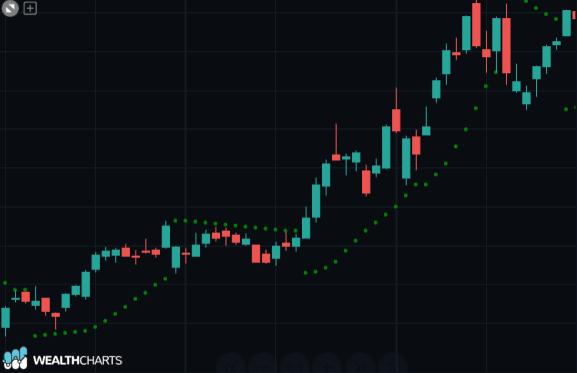
Visually the parabolic system is similar to a moving average, in practice, the price will be closely followed by a line that smoothes the peaks. Unlike moving averages, it is not the price that moves above or below the average, but the indicator itself that moves below or above the price under certain conditions, thus providing trade signals.
When the S.A.R. is above the market price, this represents a downtrend or a bearish opportunity.
When the S.A.R. is below the market price, this represents an uptrend or a bullish opportunity.