Categories
About UsHow to get startedAccount AccessBrokers and TradingScannersResearch ToolsCommunityStocksOptionsFuturesAlertsMobile AppSwing Chart - Indicator Formula
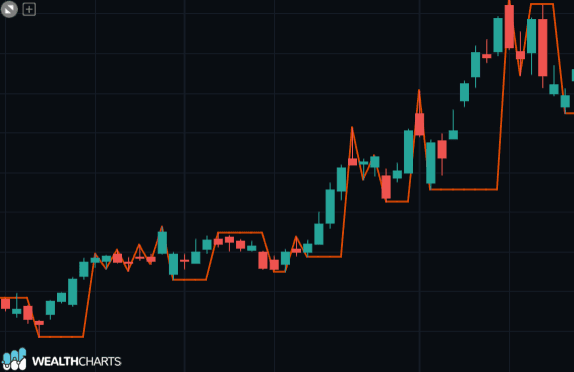
The swing chart is a chart that aims to detect trends and eliminate background noise.
In the bullish trends, it is built starting from the maximum point of a candle and, if in the following candle the maximum and the minimum are respectively greater than the maximum and minimum of the previous candle, the two maximums are joined otherwise it goes to the following candle. On the contrary, in the opposite situation.
To reverse the direction of the trend, for example from bullish to bearish, it is necessary that the second candlestick forms a maximum and minimum lower than the first; in this case there is the formation of a relative maximum. Otherwise, it is necessary that the maximum and minimum of a candle are higher than the maximum and minimum of the previous candle.
The intersection of a descending line with an ascending one forms a bottom swing while the meeting of an ascending line with a descending one forms a top swing.
If the market exceeds a top swing, the trend goes from negative to positive, while the breakout of a bottom swing reverses the trend from positive to negative.
Outside bars: they can represent reversal points, in an upward market it is sold on the perforation of the minimum of the outside bar, while in a downward market it is possible to buy the breaking of the maximum of the outside bar.