Categories
About UsHow to get startedAccount AccessBrokers and TradingScannersResearch ToolsCommunityStocksOptionsFuturesAlertsThe Chopiness Index (CHOP) - Indicator Formula
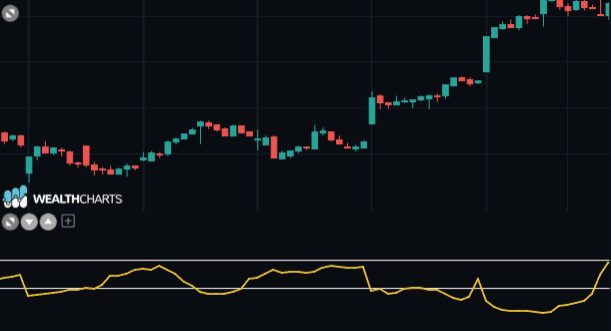
The Choppiness Index is an indicator developed by Australian commodity trader E.W. Dreiss. The Choppiness Index is an non-directional indicator that was made to help traders decide if the market is trading sideways (choppy) or if its in a trend (not choppy), The indicator is not used to determine market direction, but only to help identify the markets trendiness.
The index has values that range between 0 and 100. The higher values generally lead to more choppiness while lower values can lead to more trending markets. Traders often use Fibonacci numbers of 61.8 as the upper threshold and 38.2 for the lower threshold.
If an assets price goes above the upper threshold, sideways movement or consolidation is expected to persist.
If an assets price goes below the lower threshold, it can indicate a continuation of the trend.
Calculation:
C.I. = 100 * LOG10( SUM( ATR( 1 ), n ) / MaxHi( n ) - MinLo( n ) ) / LOG10( n )
n = User defined period length.
LOG10( n ) = base-10 LOG of n .
ATR( 1 ) = Average True Range (Period of 1).
SUM( ATR ( 1 ), n ) = Sum of the Average True Range over past n bars.
MaxHi( n ) = The highest high over past n bars.
MinLo( n ) = The lowest low over past n bars.