Categories
About UsHow to get startedAccount AccessBrokers and TradingScannersResearch ToolsCommunityStocksOptionsFuturesAlertsTillson - T3 - Indicator Formula
T3 is an adaptable moving average. Which tracks the temporal-chronological series more aggressively when it makes the big movements leading the time series to make large moves.
Like T3, T1, T2, T3, T4, T5, or T6 can also be obtained. Refer to the equation below for details. The following parameters are used:
Price - Price used as input for the calculation of T3.
Periods - Periods used in the calculation.
Volume Factor - should vary between 0 and 1. When the Volume Factor is 0, GD is like an Exponential Moving Average (MME). When the factor is 1, GD is like double Exponential Moving Average (DMME).
The formula is as follows:
T3( n ) = GD( GD( GD( n ) ) )
GD( n, v ) = EMA( n ) * ( 1 + v ) - EMA( EMA( n ) ) * v
GD is the generalization of a Double Exponential Moving Average (DEMA).
where:
EMA = Exponential Moving Average
DEMA = Double Exponential Moving Average
n = Periods
v = Volume Factor
This is similarly achieved for example:
T5( n ) = GD( GD( GD( GD( GD( n ) ) ) ) )
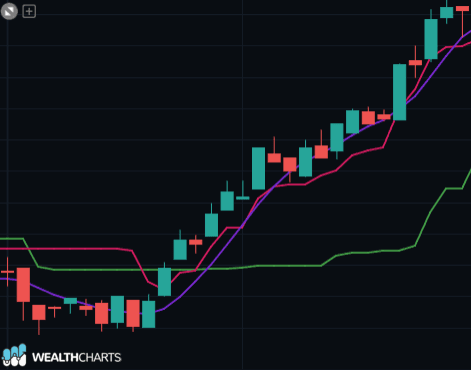
Prices moving above the Tillson T3 Line are seen as positive or could begin a bullish move, while prices moving below the Tillson T3 Line are seen as negative or could be beginning a bearish move.