Categories
About UsHow to get startedAccount AccessBrokers and TradingScannersResearch ToolsCommunityStocksOptionsFuturesAlertsMobile AppTrue Strength Index (TSI) - Indicator Formula
It envisages the use of a double smoothed EMA, which makes it possible to attenuate continuous price changes and identify the various trend shifts.
An increase in the value of the True Strength Index is an indication of an increase in the momentum in the direction of price movement.
Its formula is explained below:
TSI = 100 * EMA( EMA( MTM, FREQ1 ), FREQ2 ) / EMA( EMA( MTMM, FREQ1 ), FREQ2 )
where:
MTM = Differential Momentum( Close, FREQMOM )
MTMM = ABS( MTM )
ABS = Absolute value function
EMA = Exponential Moving Average
FREQ1 = number of periods of first EMA
FREQ2 = number of periods of second EMA
FREQMOM = number of periods of Momentum
Close = current day closing
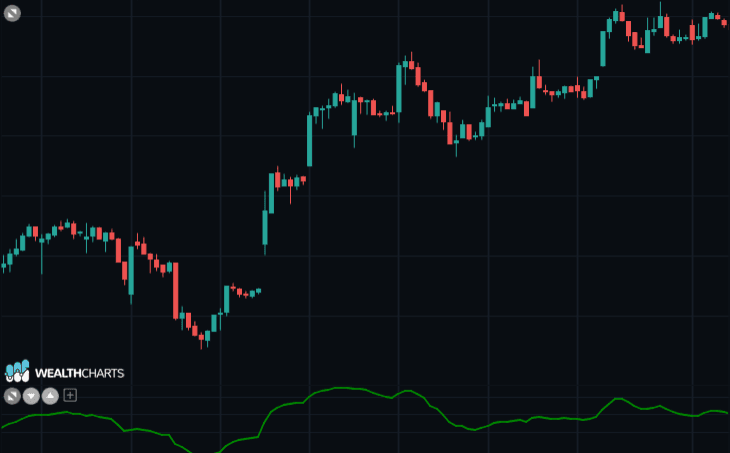
When the True Strength Index is above the Zero-Line, or positive, this represents an uptrend or a bullish opportunity.
When the True Strength Index is below the Zero-Line, or negative, this represents a downtrend or a bearish opportunity.