Categories
About UsHow to get startedAccount AccessBrokers and TradingScannersResearch ToolsCommunityStocksOptionsFuturesAlertsVariations - Indicator Formula
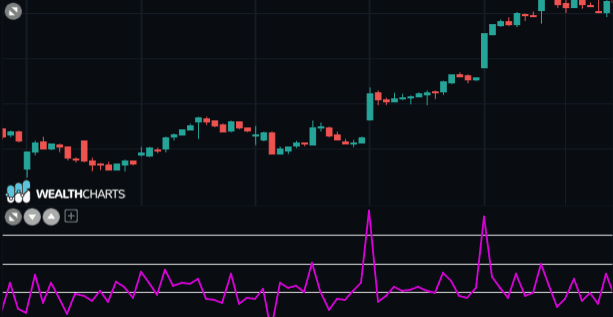
This Indicator allows you to graphically represent the fluctuation of the percentages or value calculated on the quotations made by the stock.
By setting the indicator display you will have the possibility, at the first glance, to identify the variation made by the stock in the day.
A more useful feature of the indicator can be highlighted by setting the value curve in a new field or area of the chart and creating a "Line of Values" at zero.
To set the line of Values, simply recall the properties of the scale values, with a click of the mouse (right button) and on the last tab shown in the panel (Line of Values) select the box next to the word "zero line" (if you want to highlight the zero value) or set a value to your liking, in the fields reserved for this setting.