Categories
About UsHow to get startedAccount AccessBrokers and TradingScannersResearch ToolsCommunityStocksOptionsFuturesAlertsMobile AppVelocity - Indicator Formula
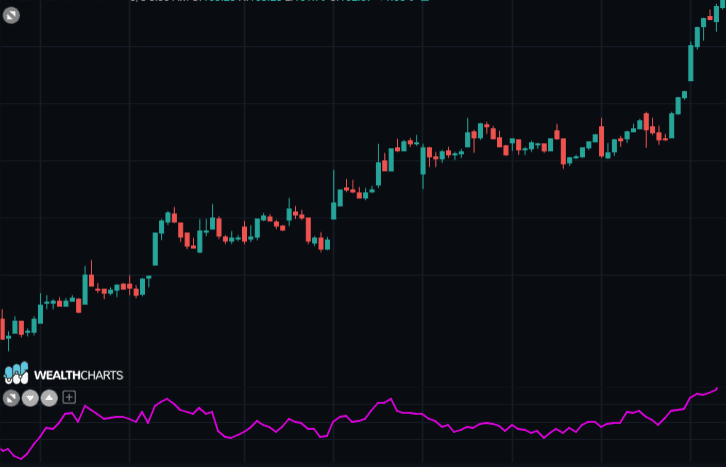
This indicator is one of the ways to depict the speed defined as the slope of the chart relative to the moving average.
The formula is as follows:
V( t ) = ( Value( t ) - MA( t ) ) - ( Value( t - pi ) - MA( t - pi ) )
Where
mmpi = Number of Moving Average periods
pi = reference periods
MA = mmpi-period Moving Average
MA( t ) = current Moving Average value
MA( t - pi ) = Moving Average value of the reference index at time t - pi
Value ( t ) = current value
Value ( t - pi ) = value of the reference index at time t - pi
The formula calculates the difference between the input value and its moving average subtracted from the same difference calculated in different time periods.
When the Velocity line is above the Zero-Line, or positive, this represents an uptrend or a bullish opportunity.
When the Velocity line is below the Zero-Line, or negative, this represents a downtrend or a bearish opportunity.