Categories
About UsHow to get startedAccount AccessBrokers and TradingScannersResearch ToolsCommunityStocksOptionsFuturesAlertsLite and Mobile App VersionWilliams %R - Indicator Formula
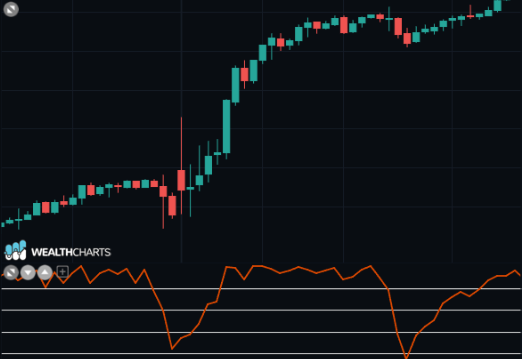
This indicator belongs to the family of oscillators, and uses the amplitude of the price in a given period to define what is called the center of gravity and on this concept, we try to establish a range of overbought and oversold.
From this we will obtain information that is nothing more than a duplicate of that provided by the stochastic; the only difference is that the stochastic exploits the difference between the closure and the minimum of the minima, while the %R exploits the difference between the maximum of the maxima and the closure; it will therefore be sufficient to observe only one of the two indicators.
Price divergences should be analyzed.
This indicator is obtained by varying the formula of the stochastic with the following:
Williams %R = 100 * H( NP0 ) - C( t ) / H( NP0 ) - L( NP0 )
where:
C( t ) = current closing price
H( NP0 ) = maximum price recorded during the time frame NP0
L( NP0 ) = minimum price recorded during the time frame NP0
NP0 = number of periods of the Williams %R indicator
During the current session t is essential to identify the values:
H( NP0 ) = the maximum between H( t ), H( t - 1 ), ... , H( t - NP0 + 1 )
L( NP0 ) = the minimum between L( t ), L( t - 1 ), ... , L( t - NP0 + 1 )
An interesting feature of this indicator is that it often anticipates the price curve, a forecast that will always have to be filtered through further operating signals.
In practice, with the use of this formula, you will always have a range of oscillation, between -100 and 0, but the values of overbought and oversold will be reversed compared to those of the stochastic, 0 -20 for the first, -80 -100 for the second.