Categories
About UsHow to get startedAccount AccessBrokers and TradingChartsScannersCommunityStocksOptionsFuturesAlertsMobile AppWealthScript: Visual Builder
The WealthScript Visual Builder tool is designed to allow a regular user that does not possess advanced coding skills to create and manage custom indicators that can be used on charts or with the Strategy Tester tool in WealthCharts.
Building out an indicator in the WealthScript Visual Builder is an easy, intuitive process, and involves adding, connecting, and adjusting indicator components (for example, other indicators or certain plots they are supposed to create), their combinations and outcomes on an easy to use drag and drop flow chart.

The example above is a simple indicator that plots a text alert on chart, whenever the ADX indicator happens to be at a value that is greater than 20. Notice how each component of this simple condition is presented in interconnected nodes – the indicator itself (ADX), the important level we are using (a constant of 20), a condition checks the ADX against the value, and a node for the action that the condition creates – an alert. Let’s dive into a bit more detail as to how you can build something like that out!
Accessing nodes and placing them on the flow chart
All of the nodes that are available for the flow chart can be accessed in the hamburger menu in the top left corner of the Visual Builder window. In here, nodes are listed under different categories and color coded accordingly to help you identify them at a glance when studying the flow chart. To add a node to the flow chart, simply select it in the menu.

Once a node is on the flow chart, it can be positioned anywhere within the chart using simple drag and drop with your mouse and deleted using the small “X” button in the top right corner of the node itself. Most nodes have inputs and/or outputs, which show up as little circles on the left or right edge of the node accordingly, and can be connected with lines by dragging them to each other.

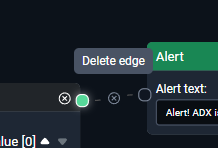
To delete a connection, simply select the line, and then click the little “X” button within the line.
Note that connections must be logical. A node that requires inputs cannot be operational without them, such as a moving average for example – it requires a price value as an input, such as close prices. Nodes can and need to be daisy chained to ensure continuity and should make sense. For example, you cannot connect a moving average to an alert directly and expect for anything to be happening on the chart with that condition, but you can certainly compare two moving averages to each other in a conditional node and have an alert show up when they cross over each other.
Let’s take a closer look at the various nodes that are available!
User Input
A node that asks the user for information at runtime, and then stores it in a variable during execution. This is a value that you can use when comparing an indicator to it, like we did in our example earlier with an ADX being above 20, however in this case the value is user-defined when the indicator is loaded on the chart. Think of it as an indicator setting or input!

The user input consists of three settings:
-The Name of the variable that it will be referenced by in the indicator code and settings menu
-The Type of the input which can be an integer (a whole number), a float (a number with a decimal point), a color (rgb value), a Boolean (true or false statement) or string (any text and/or numbers/symbols).
-The predefined value of the input which will be suggested to the user by default and used if no other is provided.
Technical Analysis
The Technical Analysis node gives you access to the plots of our pre-built and marketplace technical analysis formulas. For marketplace formulas, you are limited to the ones you have access to, i.e. have purchased. This is one of the most used nodes as indicators are very often based on other indicators and their outputs. Using this node, you can source data such as the value of a moving average, the existence of a buy or sell dot signal from a marketplace indicator, the value of an ADX or the price level of a ParSar per say. Note that a lot of indicators require an input, such as moving averages, for example. They cannot work without defining whether they are based on close prices per say, or maybe even another indicator such as volume. If an indicator like that lacks a required source, you will see a red exclamation mark show up in its node.
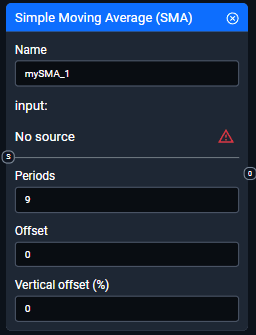
A technical analysis node will typically have a name setting that will be used to reference it later in the code, and any inputs that the underlying indicator has. Note that some of the indicators will have multiple outputs available to pass on the values of different indicator components/plots.
Constant
A constant is a way to define a fixed numerical value that will be used later in the code, for example in conditional statements like we did with the ADX example at the beginning of this article.
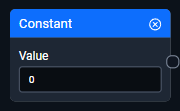
A constant will offer only one setting – its value.
OHLCV Series
OHLCV series stands for Open, High, Low, Close, Volume, and various combinations of these items, such as high + low divided by 2, high + low + close divided by 3, etc. These are critical both for when you want to use what is happening with the bars on the chart (for example several bars making consecutive lows, etc.) or just looking for a data source for an indicator such as a moving average.

The OHLCV Series offers a single dropdown with all the different o/h/l/c/v values that can be selected and their combinations.
Mathematical Operator – Add
The Add node refers to an element which combines input values/nodes and produces an output (the summation of all input nodes), for use in your technical analysis formulas. This can be used to summate two values for further use or perhaps, a plot. For example, the high price of a bar + 10:

Interesting fact: On the screen above, we can see a feature that is going to be popping up for other mathematical operators and conditional nodes down the road – past bar values. Notice the up/down arrows next to the high value – clicking these increments/decrements the [0] next to “high”. A “high [2]” would refer to the high value of two bars ago, high [14] – 14 bars ago etc., and high [0] is, of course, the high of the current bar being looked at. This is a powerful feature and allows you to look for bar patterns and trends!
Mathematical Operator – Subtract
The Subtract node refers to an element which combines input values/nodes and produces an output (the difference of all input nodes), for use in your technical analysis formulas. Please note that the order of numbers in the subtraction node matters.

For example, you can subtract 10 from the low of a bar and use the value to plot a dot or a horizontal line exactly 10 points below the bar.
Mathematical Operator - Multiply
The Multiply node refers to an element which combines input values/nodes and produces an output (the product of all input nodes), for use in your technical analysis formulas.

For example, you can grab the close value from 10 bars ago, multiply it by 2 and plot it over the current bar.
Mathematical Operator – Divide
The Divide node refers to an element which combines two input values/nodes and produces an output (the quotient of the two input nodes), for use in your technical analysis formulas. Make sure to connect the inputs in correct order, and be careful with dividing by 0!

For example, the Divide operator can be used to take the value of a moving average, divide it by two, and use the resulting value elsewhere in the code.
Pro Tip: Mathematical operators can be daisy chained. Here’s an example:

Conditional Statement
Conditional nodes use logical operators (such as "<=," "==," and "!=") to evaluate two nodes, allowing for decision-making and control flow in your technical analysis study. This is a fundamental component of any algorithm, that allows you to make decisions in the code if a condition is met. For example, if a buy dot = true, then plot an alert, or if moving average 1 crosses over moving average 2, plots a signal on the chart, etc.
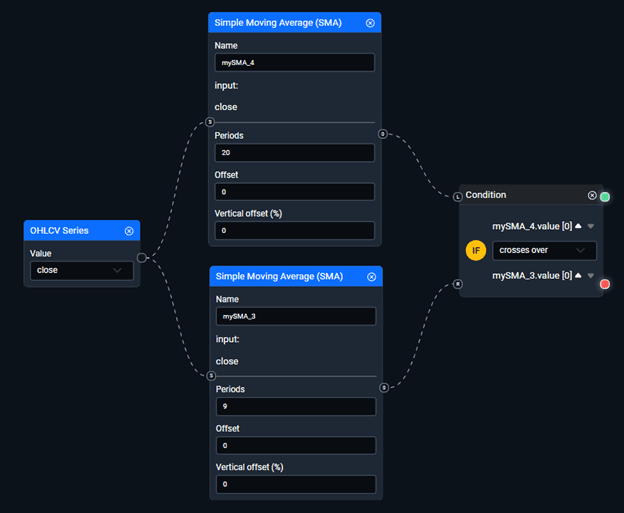
A conditional node accepts two required inputs for the two values that are to be compared within the condition. Two outputs are also available allowing you to branch the flow: the green path will be executed when the condition is true, and the red path will be executed when the condition is false. Note that it’s not compulsory to use both outputs – even one is sufficient, and in all other cases the code will simply not do anything until the condition that has a path is met.
The dropdown in the conditional statement allows for a wide variety of logical operators: > (greater than, < (less than), != (not equal to), >= (greater than or equal to), <= (less than or equal to), == (equal to), crosses over, crosses under.

Pro Tip: This is another place where past bar values are often used – notice the up/down values that show up next to the inputs used in the conditional statement. For example, we can go down a certain path if the close price value of the current bar is lower than the close price of the previous bar – a down trend.
AND Node
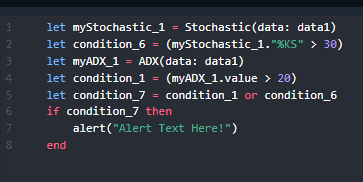
And Nodes are a boolean logical operator that returns "true" if and only if all input nodes are true; otherwise, it returns "false”. In simple terms, using these you can unite conditional statements into groups, where the code continues to flow only if BOTH conditions are met. Here’s a quick example, modifying our script from the beginning of the article: If an ADX is greater than 20, AND the Stochastic is above 30, then proceed with plotting an alert on the chart:

OR Node
This is the opposite of an AND node. Using this, you can tell the code to proceed when even one of the conditions linked to the node is true. The use case example is very similar – if the ADX happens to be above 20, OR the stochastic rises above 30 – plots an alert:

Trading Strategy Node
Using this allows you to define entry and exit rules, quantity, price, and timing of your trades to be used in the Strategy Tester or directly on a chart as a visual effect highlighting where a trade would have happened. You are required to have an output node of Indicator Plot or Trading Strategy for your code to function correctly.

This node has all the settings required for a trade decision:
What type of action is taken – Does the code generate a long or short trade at this step, or perhaps you need to close an existing long or short trade.
Quantity – How large the trade will be, and whether you want to define a specific size for it below.
Timing – Does the trade execute immediately, or perhaps with the opening of the next bar?
Price – Should the immediate market price be used to place the trade, or does the code need to wait for the open or the close price?
Indicator Plot Node
In technical analysis, a plot refers to a visual representation of indicators on charts and subcharts. We provide various types of plots, such as: lines, dots, histograms, and many more. You are required to have an output node of Indicator Plot or Trading Strategy for your code to function correctly.
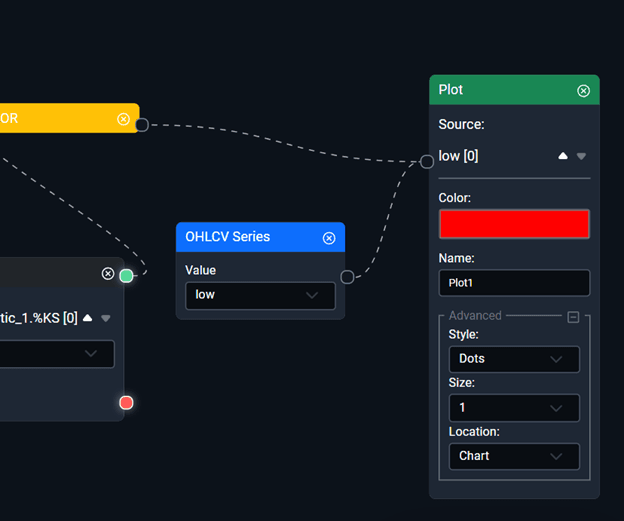
Important: an indicator plot always requires two inputs – a decision to create the plot based on a condition, and a price/value to be used as the vertical coordinate for the plot. For example, the code snippet above generates a red do at the low price level (takes past bar values too if would like to shift it backwards on the chart), which would be exactly underneath a bar.
The indicator plot node has a lot of settings:
-The color toggle allows you to access a palette of colors for your indicator plot.
-The style dropdown has a lot of different shapes available for the indicator plot: dots, diamonds, lines, etc.
-The size setting determines the size of the indicator plots.
-The location can be set to the main chart area with the price bars, or a subchart of your choice.
Alert Node
The alert node creates a small box with a notification at the top of your chart when the condition for it is triggered. This does not involve any sound effects or other notification types, but is a handy way of drawing your attention to an important event that has happened on a chart.
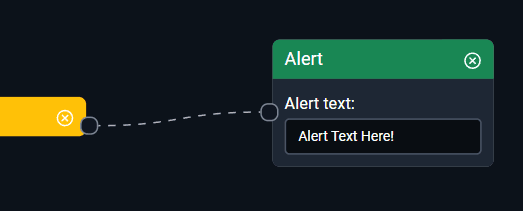
Once connected, the Alert node takes one simple setting – the text of the alert.
Comment Node
A flow chart for a complex indicator can easily grow large and unruly. To help you remember the logic behind various parts of the chart, the comment node can be used to save your comments within the code.

My code is built. What’s next?
Once your flow chart is full of elements, and the code is ready to be executed on a chart as an indicator, you will need to save and compile your code. This is where the buttons in the top right corner of the Visual Builder step in.

-Save and compile – This will prompt you to save the code (after naming it), will compile it, and if compilation is successful, the indicator will now be available under the Add Indicators > My Technical Analysis menu. Grab it from there and place it on your chart!
-Save – This button will save any changes you’ve made withing the current code.
-Save As New – Allows you to save a new indicator under a different name rather than overwriting the one you were working with initially.
-Open Scripts – Using this, you can browse and access any scripts you’ve built out and saved earlier.
-Reset – Gives you a clean start with an empty flow chart.
-Undo/Redo - The actions you make in the flow chart are logged, and if you accidentally make a mistake you can quickly undo or redo them using these buttons.
-Show Code – This button allows you to see what your indicator looks like in WealthScript Code.
Pro Tip: Use the Show Code button to learn more about how WealthScript Code works, by looking at how the Visual Builder flow charts translate into WealthScript!
Flow Chart Navigation Buttons
The buttons in the bottom left corner of the Visual Builder screen are there to help you navigate around the flow chart.

-Zoom in/Zoom Out – The “+” and “-“ buttons allow you to zoom in and out of the flow chart. The same actions can also be done using the scroll wheel on your mouse.
-Fit View will quickly adjust the zoom levels and pan your flow chart to fit in all of the nodes.
-Hide/unhide mini map allows you to hide the little minimap that shows up in the bottom right corner. This tool is there to help you navigate a complex chart with lots of nodes!
