Categories
About UsHow to get startedAccount AccessBrokers and TradingChartsScannersCommunityStocksOptionsFuturesAlertsMobile AppStrategy Back Tester
The Strategy Tester tool is designed to help you back-test indicator-based strategies using historical chart data. Alongside other tools in WealthCharts such as chart replays, simulations, and paper trading the strategy tester is there to help you hone the performance of your strategies, but this time from an automated perspective. The strategy tester tool is compatible with scripts that are designed by their developer with backtests in mind, such as the MAC Swing strategy that we will be using as an example in this article, but most importantly, also compatible with any WealthScript-based indicators that you build out using tools such as the WealthScript Visual Builder. Make sure to check it out if you haven’t already!
Setting up a backtest
Before you can run or see any results, the strategy tester has to be set up with the inputs that you would like to use. Open the tester tool and click the “Set up backtest” button to begin.
To set up your backtest, you will need to provide a symbol here, as well as a specific timeframe and date range for the chunk of historical data that will be used.
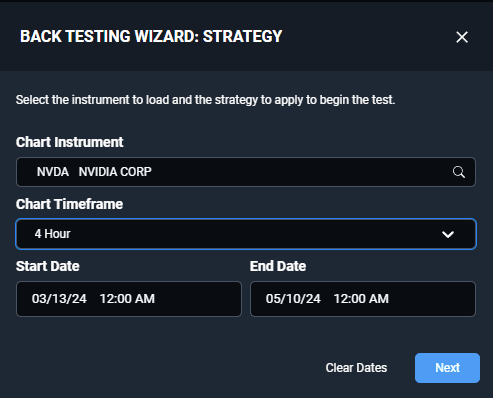
Setting these up is more or less straightforward – the “Chart Instrument” input allows you to type and search for symbols, the “Chart Timeframe” is a dropdown with multiple timeframes available to select from, and the date range will require you to pick a date twice in the calendar tool – the start date and the end date.
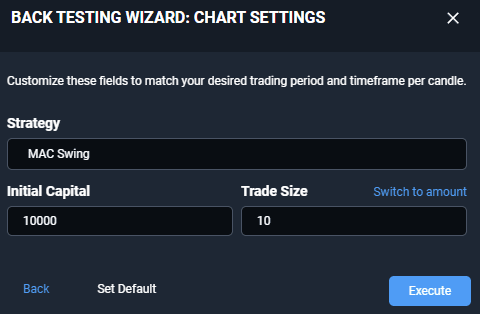
Click on “Next”, and some more inputs will become available. Here, you will need to pick s Strategy in a familiar “Add Indicators” menu. Note, however, that not all of the strategies here will be compatible with the strategy tester tool – the ones that are not will be greyed out.
After you have picked a strategy, make sure to specify how much capital will be used for the back test, and what trade sizes will be applied to the simulated trades. Note that right above the Trade Size input you can switch between specifying a Trade Size and a Trade Amount using the corresponding toggle.
After you click on “Execute”, a window with inputs and settings for your strategy will show up, if such settings are available. These are quite numerous with the example we are using here, but will differ heavily depending on the particular strategy being used.
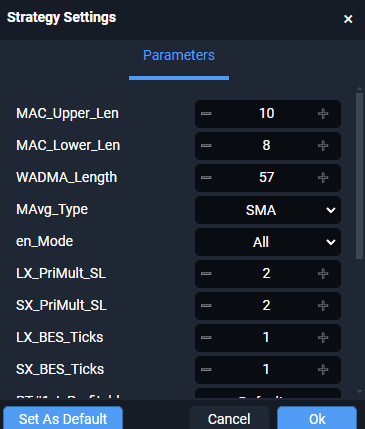
Once you click on OK here, the strategy test will be executed.
Evaluating the back test
Once the strategy test is launched, you will be presented with a chart and results. The chart will have all of the trade entries highlighted with red/green areas and arrows indicating entry and exit points. To the left of the chart, you will find a report on the performance of the back test, with detailed numbers offering insight into profit/loss, best, worst and average trade results, a breakdown of drawdowns and more.
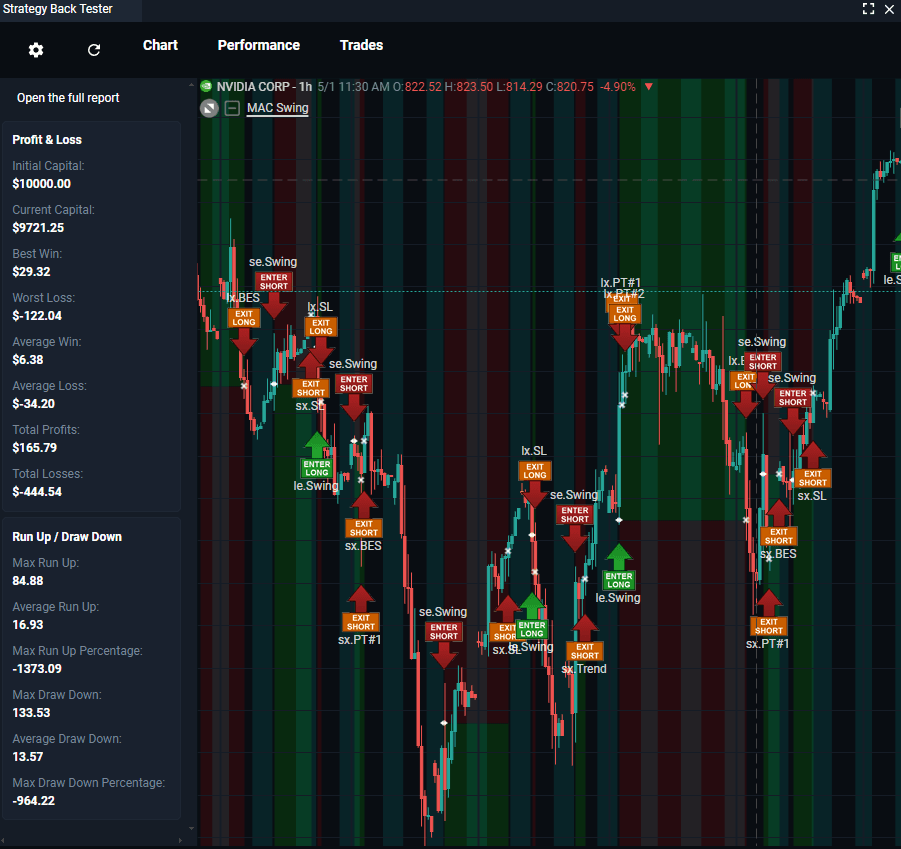
Even more data is available by clicking the Performance and Trades buttons at the top of the strategy tester.
Under performance, you will find some of the following metrics in a convenient visual format:
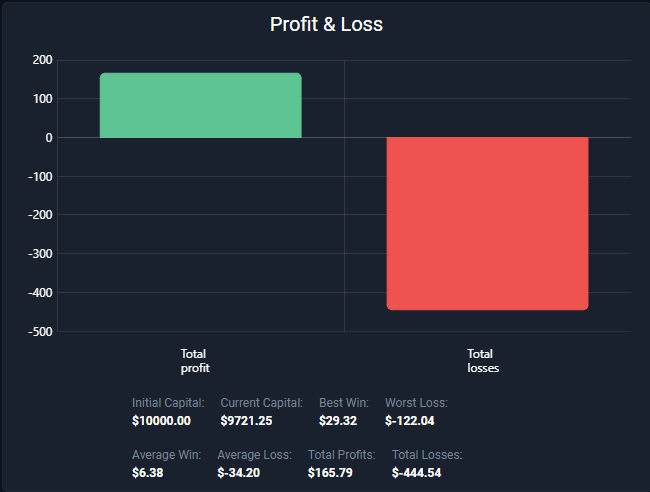
Profit/Loss graph
This graph offers a comparison of total losses to total profits during the course of the back test, along with additional numbers on best, worst and average results beneath it.
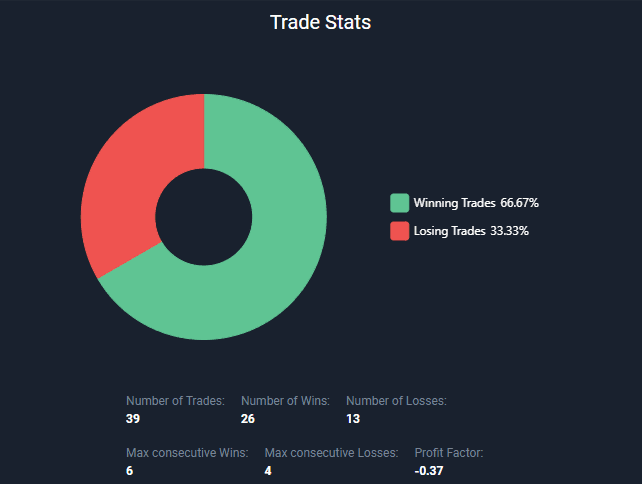
Trade Stats
This pie chart offers a detailed breakdown of the complete number of trades along with details about consecutive wins and losses.
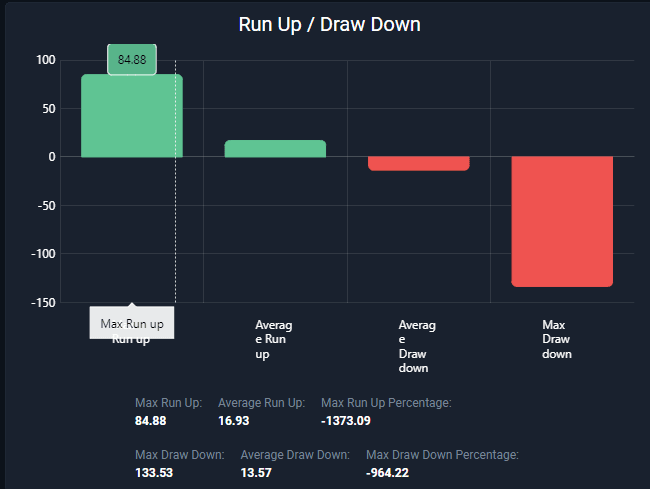
Run Up/Draw Down
The run up and the draw down are both very important metrics that allow you to evaluate the maximum profit or loss potential during the course of the back test. These could be of much consequence, especially if you are planning on using any kind of leverage in your trading.
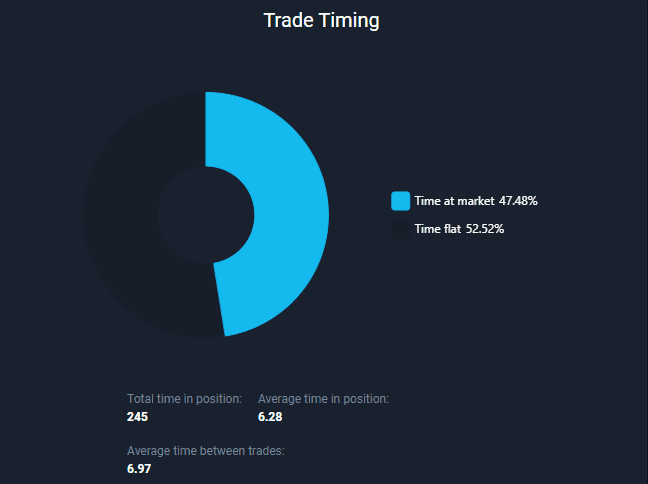
Trade Timing
This is a graph that will help you understand how active this strategy is, and what kind of trade frequency and holding times can be expected.
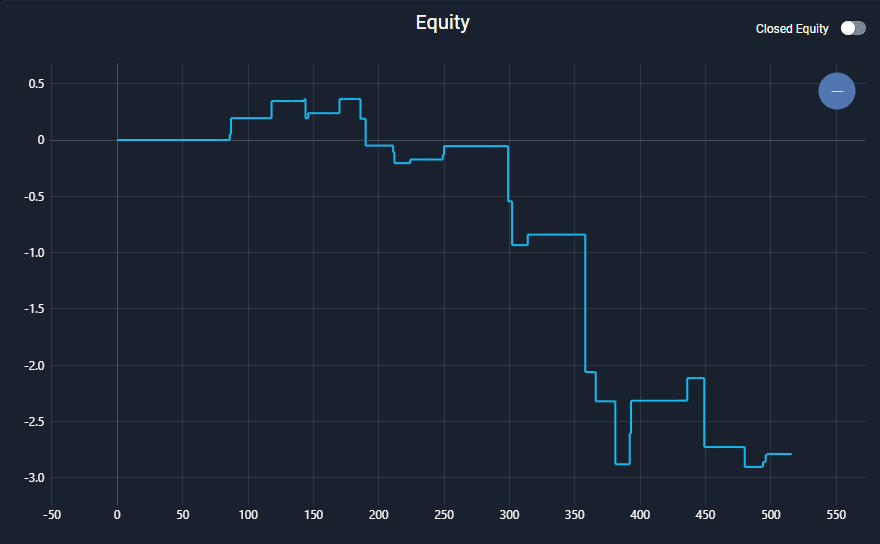
Equity
The equity graph will offer data on how the account balance was changing during the course of the back test and can be viewed as both closed trade equity and open equity using the toggle in the top right corner.
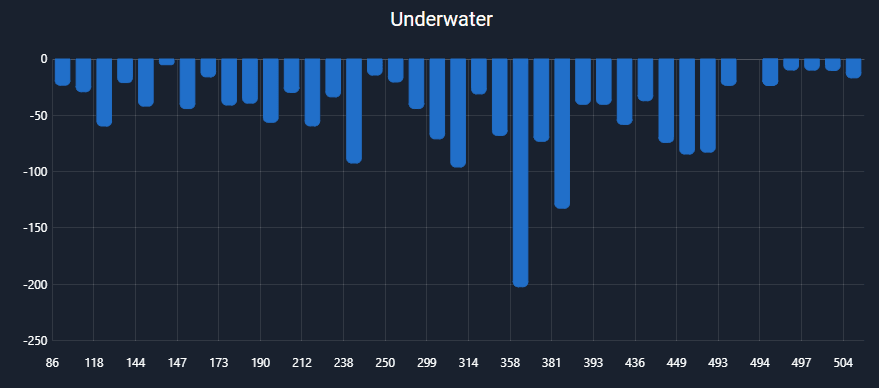
Underwater
This graph offers a historical view of how the drawdown has been looking during the entire course of the back test.
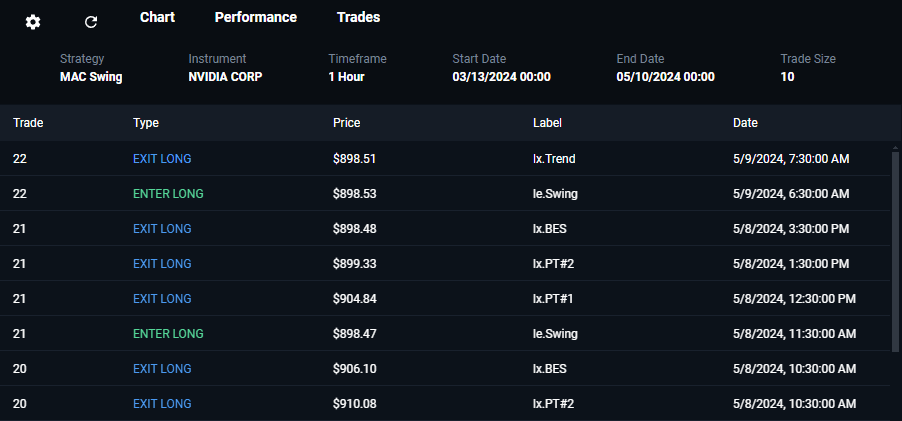
Trades
Select the “Trades” button at the top of the strategy tester to see a complete record of all individual trades placed during the course of the back test.
Done with the back test? Run another one!
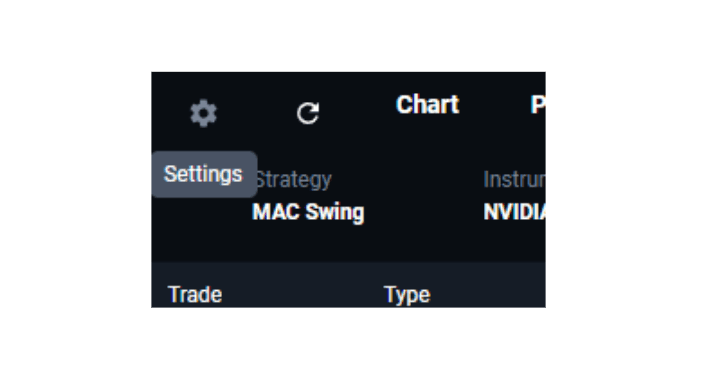
Up in the top left corner, you will find two buttons: “Settings” and “Recalculate”. The Settings button allows you to recreate the back test with new inputs such as the symbol, date range, capital and trade size. The second button, “Recalculate”, allows you to re-run the same back test with new indicator settings being used.