Categories
About UsHow to get startedAccount AccessBrokers and TradingChartsScannersCommunityStocksOptionsFuturesAlertsLite and Mobile App VersionWealthScript: Introduction
WealthScript Code Editor allows users to design indicators the old-fashioned way. With Code Editor you have access to a lightweight development kit within the platform which flags any errors you may encounter. Just like Visual Builder, you can build as you go within Code Editor, making changes, compiling, and watching those changes appear on your charts in real-time.
Like all programming languages, WealthScript has reserved words and symbols. You will notice these within Code Editor when you type them as they will appear as red or blue text. Code Editor also allows you to single-line comment and block comment your code, so you can write down notes for yourself or others.
These reserved words are, but are not limited to:
Let, input, var, array, function, const
If, then, and, or, =, ==, cross, crosses, over, under, below, else, elseif
(Plot Designs) - Line, Dots, TriangleUp, TriangleDown, Columns, Histogram, Bands, Dashes, Crosses, Squares, Levels, Diamonds
Non-colored reserved words - Date, Time, open, close, high, low, range, plot, alert, buy sell, ohlc
Example image of some very basic code with these colors:
Like all indicators, we want to visibly show something happening. This can be a buy signal, a sell signal, a moving average, or whatever you would like. To create the visual, we use what is referred to as a “PlotStyle”. This tells our indicator what the signal looks like visually on our chart. PlotStyle requires 3 pieces of information, the signal number, the signal design, and the signal size. You may be wondering where we insert the location, name and color, these come later when we actually call to “Plot” the visual. Below is an example of what the PlotStyle code and Plot code look like.
Example image:
As you can see in the image above, our PlotStyle has the value 1, for the signal number, Dots for the signal visual, and 5 for the signal size. We also use Plot, however we add a 1 after it to make it Plot1. This tells the indicator the point we are plotting is tied to the PlotStyle with the signal value of 1. Next we tell the indicator where we are plotting this signal, in this example, I use the low of the current bar. Then we follow up with a name which we put in quotation marks to signal this is a string value, here I used “Buy Signal”. Lastly, a color is assigned, this can be a color name or an rgb value such as RGB(255,0,0) for red, or you can simply put Red
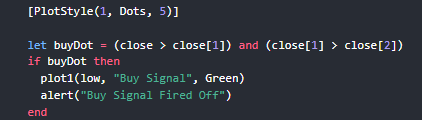
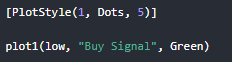
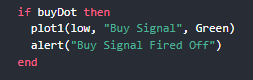
Indicators can be simplistic, and they can also be very complex. While Code Editor can be used to create complex indicators, it isn’t a necessity for an indicator to be complex in all cases. With the code shown in the first image below, this is a simplistic indicator which creates a green “Buy Signal” at the low of every bar. With the code shown in the second image below, this is still a simplistic indicator, however we give it a requirement that must be met in order to fire off the signal.
Although both examples are fairly simplistic, you can see the complexity of the indicator growing between image 1 and image 2.
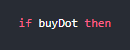
In the second image, you will see words like “let” and “if, then, end” as well as a line that says “alert”. In WealthScript, the reserved word “let” is used to identify a keyword, in this example, the keyword is “buyDot” and is being used as a boolean type. This means we return either a true or a false value. We set this true or false check to see if the close of our current bar is greater than the close of the previous bar, AND that the close of the previous bar is greater than that of the bar before that. This is shown as (close > close[1]) where the [1] signals 1 bar in the past, we could also use close[0] to signal the current bar, but close on its own does this anyways. Below are two images, image 1 where “buyDot” returns false, and image 2 where “buyDot” returns true.
Image 1:
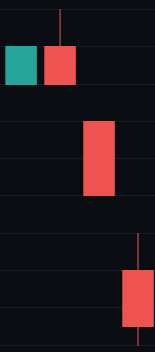
Image 2:
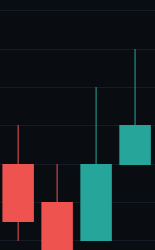
As you can see in image 1, the close of these bars are lower than the previous, which does not meet the requirements of “buyDot”. If you look at image two though, you can see the bars are greater than each other, and does meet the requirements of “buyDot” and therefore returns a value of true.
“If” statements always have a “then” as well as an “end”. You can look at these in real world applications, such as “if” chicken is on sale “then” you buy the chicken. The same applies with indicators, in the earlier example, we looked at the statement as follows.
We defined “buyDot” earlier, so if “buyDot” is true, then we do something. In the earlier example, I created a visual signal when this condition was met, and I also created an alert which would pop-up on my chart. This is all I wanted to happen when buyDot was true, so I then end my statement.
Sometimes people look for more specific happenings when a condition is met. Going back to our earlier example of shopping for chicken, perhaps we want the price of the chicken to be at a specific threshold as well. This can be done in many different ways, but I’m going to enhance our current statement to be a little more strict.
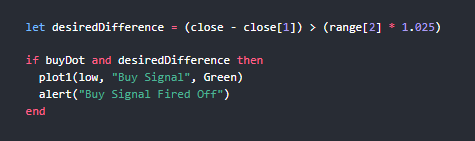
In this example, I added a new line of code and modified an existing one. The new addition is a boolean type called “desiredDifference”. What this is checking for is if the close of the current bar minus the close of the previous bar is greater than the range of 2 bars ago multiplied by 1.025, or more simply put, if the current bars close minus the previous bars close is 2.5% greater than the range of 2 bars ago.
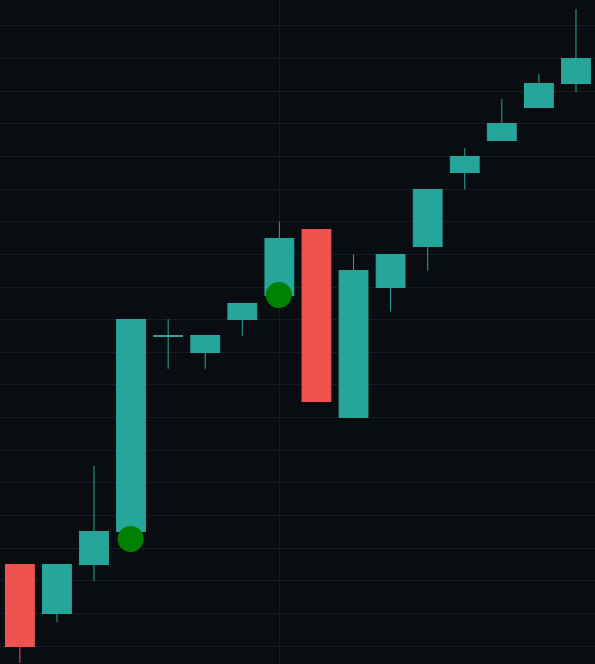
This makes the statement more strict, but it also allows for potentially stronger signals. Here is the strict indicator in action.
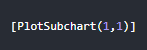
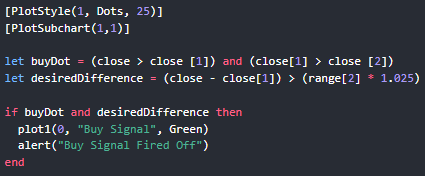
Alongside on chart visuals, you can create subchart visuals. We can do this by adding in a “PlotSubchart”, which takes a signal number and a subchart number. This can be seen in the image below, and the image below that shows the whole script.
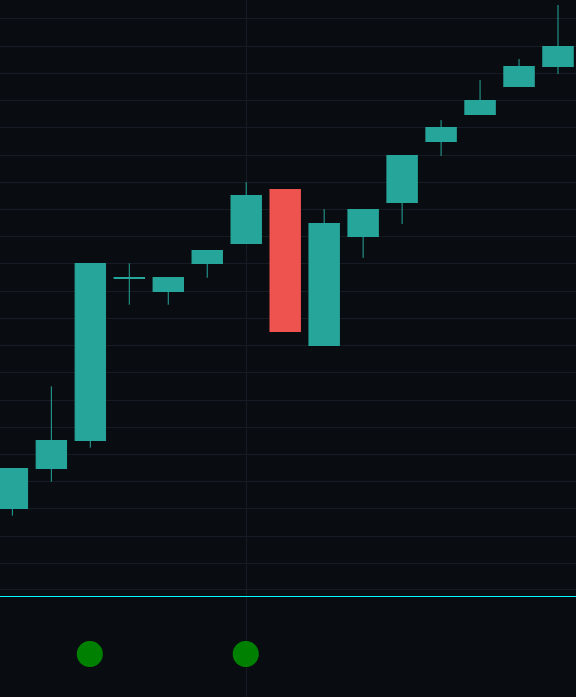
This small change shifts the visual to a subchart which helps keep the chart clean. You can see this in the image below.
Now that the basics are covered, and maybe you have even written an indicator, you may be asking, “How do I save this and add it to my chart?” or even “What do the buttons on the right hand side of my screen do?”
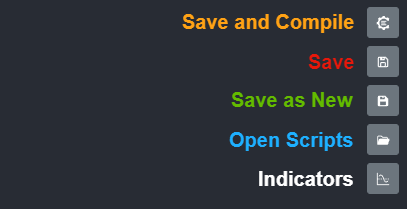
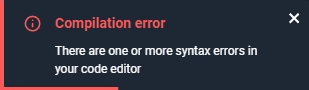
Starting from the top, you have “Save and Compile”. This button saves the indicator and compiles the code which allows you to add it to your charts. If there is an error, you will get a notification in the top right hand side of your platform.
If your code has no errors and is ready to add onto a chart, you will receive a notification letting you know the compilation was okay.

You may have noticed there are three different buttons for saving, one of them which was just covered, and the other two, “Save” and “Save as New”. Save simply saves changes that we made to the indicator itself, but does not compile/add these changes to the indicator which you add to the chart. This is great if you’re working on something and need to step away for a moment. It allows you to save your changes, even if incomplete, while still allowing you to utilize the indicator in its last compiled state.
Save as New simply saves your work as a new indicator. This can be great if you’re trying to make big changes, but you’re not sure how they are going to affect the indicator you’ve currently built. Rather than needing to undo changes, you can simply “Save as New” and give it a different name such as “My Indicator V2”
The fourth icon is “Open Scripts”, which allows you to view all of your WealthScripts.
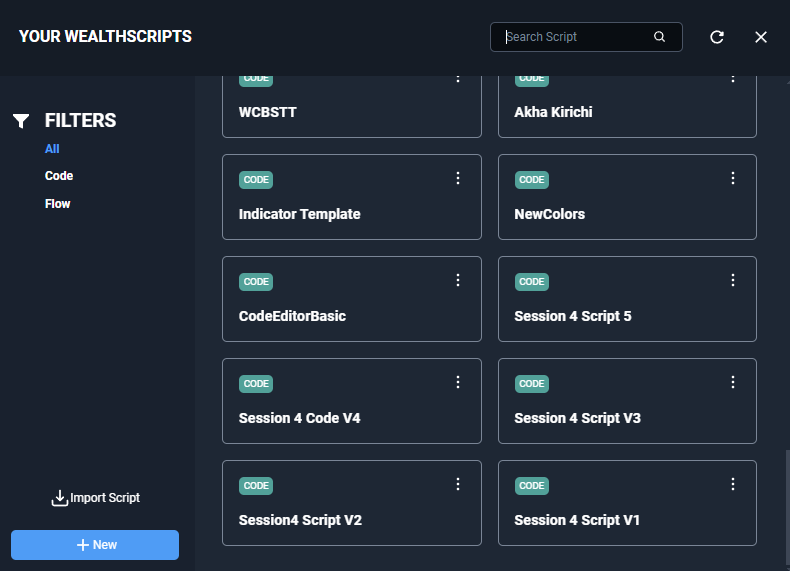
You can click on any of your scripts to start modifying the code, you can import a script using an import code(which is currently a one time use). Or you can create a new script. Each script you’ve made has three dots in the top right within this window, clicking these three dots brings up a new menu.
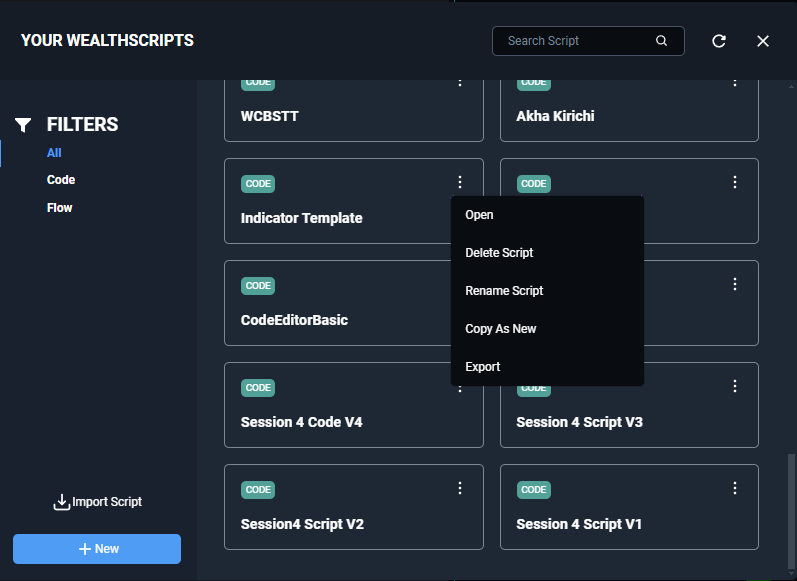
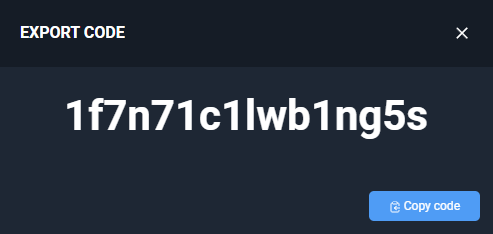
This menu allows you to Open, Delete, Rename, Create a copy, or Export. If you’re trying to share a script with a friend, you can export your script which will give you a code. This code, as mentioned above, is a one time use, and can be copied by simply clicking the “Copy Code” button located in the lower right hand corner.
The last icon is the “Indicators” icon which allows you to import existing indicators into your script. This is very useful especially if you’re trying to enhance an existing signal, or even if you’re using multiple Simple Moving Average(SMA) values on your chart.
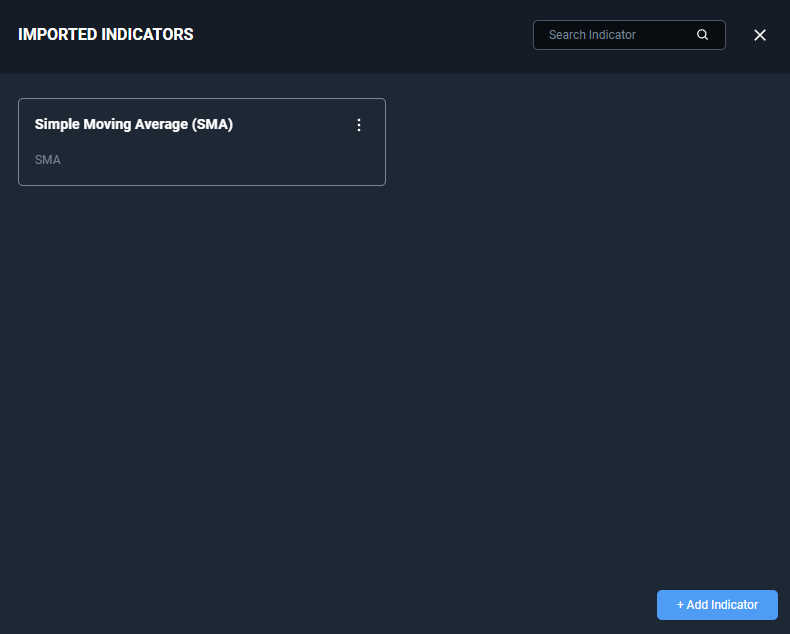
By default, your script will have no imported indicators, to add some to your script you can click on the “+ Add Indicator” button in the lower right, and find the indicator you wish to add.
When an indicator is added to your script, you will have the ability to click the three dots in the top right hand corner of it within the “Imported Indicators” window.
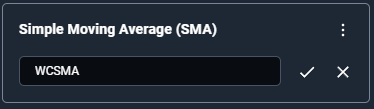
This will provide you with the option to view Code Snippets, Rename the Import or Remove the Import. For educational purposes, I am going to rename the import to “WCSMA”.
The Code Snippets now update to show the renamed import, and you can copy these imports using the “Copy” button which is highlighted in Orange on the picture below.
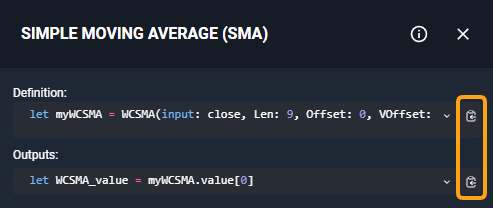
With these copied, you can put them into your Code Editor Space and modify variables as needed. This can help save a lot of time writing code, and is a very quick and easy way to get your indicator up and running.
[PlotStyle(1, Dots, 25)] [PlotSubchart(1,1)] let buyDot = (close > close [1]) and (close[1] > close [2]) let desiredDifference = (close - close[1]) > (range[2] * 1.025) if buyDot and desiredDifference then plot1(0, "Buy Signal", Green) alert("Buy Signal Fired Off") end