Categories
About UsHow to get startedAccount AccessBrokers and TradingChartsScannersCommunityStocksOptionsFuturesAlertsMobile AppWealthScript: Strategy Example
Here you'll find a tutorial on how to build a basic strategy with both the WealthScript Visual Builder and the WealthScript Code Editor
The Underlying Strategy
For this example, we'll use a very simple but effective strategy called Moving Average Crossover where we use two moving averages with different lengths to identify potential buy and sell signals.
The logic behind it will use one Simple Moving Average with 200 periods that we'll call longTermSMA and another one with 50 periods that we'll call shortTermSMA, both based on the bar's price.
When the shortTermSMA crosses over the longTermSMA we'll open a Long Position and when it then crosses under the longTermSMA we'll close the Long Position.
Visual Builder
Let's try and create our first great strategy using the visual builder!
First things first, lets open our visual builder by going to the main menu in the top left and adding the WealthScript Visual Builder widget, found under the WealthScript subcategory of Research & Analysis Tools category, to our dashboard.
Base blocks
Now that we are set up lets start adding our nodes!
Let's click the hamburger menu in the top left of the widget to open the side menu containing all of the parts we need for our example.
We'll need two Simple Moving Averages, so we can just click on the Technical Analysis option, in the Inputs category, which will open up the same window as when you're adding an indicator to a chart.
From here just look for the SMA indicator in the search bar and then click on the name Simple Moving Average (SMA) which will add the Moving Average to our widget.
But let's stop for a minute and take a look at what we've just added.
You should have a node Simple Moving Average (SMA) in the center of your screen, so lets adjust the default parameters to our needs.
We'll change the Name to longTermSMA (you can name it whatever you want, but we'll go with the name that we've decided on previously) and increase the Periods to 200,
but as you can see there is a red warning in the input section and if you hover over it, we can see that the needed input is missing.
How do we fix this? We connect a valid node as the input source to the input handle of our SMA node.
Since we've decided to base our strategy on the bars price we can go back to the menu and click on the OHLCV Series option, containing many useful predefined values.
After the node appears inside the widget you can select the close option on the OHLCV Series value selector and connect its output handle to the input handle of our SMA node.
Now you should see a dashed line connection between our two nodes and the warning about missing a source being replaced by the close value of the bar.
Let's repeat the process to add our second SMA calling it shortTermSMA and setting the periods to 50.
Pro Tip: You can add a second OHLCV Series node for the shortTermSMA input or just reuse the one we just added for the longTermSMA.
Adding the conditions
After we set these base blocks, we have to check when the two Averages cross over each other.
To do that we'll need two Condition nodes, which can be found by scrolling down to the Conditions category.
The Condition node will need an Input on the L and the R handles and will compare the two as specified by the value selected in the dropdown menu between the two sources (L compared to R).
Next, we'll connect the shortTermSMA output to the L input handle of the two condition nodes and the longTermSMA to the R input handle of both conditions.
After this, we'll set the compare option of the first one to crosses over and the second one to crosses under and our connections are all set!
Finally, to complete our strategy we need our Trading end points.
We know the drill by now, so open up the side menu and add the Trading Strategy node found under the Actions category.
The only thing we need to customize is set one action to Enter Long and the other to Exit Long (you can play around with the other parameters if you want but they're not essential to this tutorial)
Pro Tip: Let's sidetrack a little!
On the top right action panel we can see the bottom button Show code is enabled and if we click it a small panel will appear at the bottom of our widget.
In here you'll find the underlying code our visual builder just generated so if you're trying to take your first steps to learn to code from the text editor or maybe you're just curious - you can keep it open and watch it code along with you while you're changing things up in the visual builder.
Finishing with the end points
Alright, now lets actually finish this formula by connecting the Conditions to the Trading Actions, so they only trigger when the condition is met and not on every bar.
The Condition node has two output handles: one Green for when the condition is met and one Red for when the condition is not met, so since we only need to Trade when the conditions are met, we can connect the Green handle of the nodes to their appropriate Trading Action.
details If we want to go above and beyond
We can also add some visuals to our indicator to see what's going on with our Moving Averages.
We can add two Indicator Plots from our side menu and customize them to connect to the outputs of our SMA nodes.
We've done it!
Just like magic, you've created your first strategy **without the complexity of coding** in a text editor, now you've got all the tools to **create your own trading masterpieces**.
Code Editor
Let's try and create our first great strategy using the code editor!
Info
This will not go in depth into the syntax of the WealthScript Language - you can [check out the syntax specific page here](/syntax/) for more information regarding that.
Warning
This might require some knowledge of coding so if you want something more beginner friendly you can check the same [tutorial, but for the visual builder]
Set up:
First things first, lets open our code editor by going to the main menu in the top left and adding the WealthScript Code Editor widget, found under the WealthScript subcategory of Research & Analysis Tools category, to our dashboard.
Base blocks
Now that we are set up lets start writing our code!
As the starting point we'll need to define our Simple Moving Averages.
We can add them by clicking the bottom button called Indicator in the top right action panel. This will open up a window where we can find all of the imported indicators.
Let's click on the + Add Indicator and select the Simple Moving Average (SMA) indicator.
Tip
If you don't know the correct way to define every indicator, or the parameters to use - no worries, we have a trick for you!
While we're still in the import window you'll see in the top right of the SMA Import an Additional Options kebab menu, let's open the menu and click on Code Snippets.
This will open an info panel containing the definition snippet and all of the available values of the indicator and how to access them.
Now you can just exit the window and paste the ready to use lines of code defining the Moving Average, using all of the defaults parameters - try for yourself, and you should get something like this:
Let's use this line of code to customize what we need and define the two Moving Averages like so
Adding the conditions
Now we need some conditions! We can either define a condition as an alias using the `let` keyword and then check it in the if statement or just check if the condition is met in the if statement.
For simplicity, we'll go down the second route and use the `crosses over` and `crosses under` logical operators to build the condition
We start the statement check with the keyword `if`, after that we insert the condition and "then" use the keyword `then` to start listing the instruction to execute if the condition is met.
Even though it's not the case, if you also want to specify a list of instruction in case the condition is not met you can start that block with the keyword `else`. Finally you'll need to close the statement with the keyword `end`
So in our case it will look something like this:
``` ws
```
Finishing with the end points
Finally to complete our strategy we need our Trading end points.
For a long strategy you Enter using `buy` and exit using `sell`.
For both, you need to specify the time of the trade between `next bar` or `this bar` (we'll choose `next bar` for this example) and a price which can have a list of numerical values and selected keywords (to keep it simple we'll just use `at market`).
You should have something like this:
``` ws
```
Now we put the trading actions inside their appropriate if statements and the final code should look like this:
If we want to go above and beyond
We can also add some visuals to our indicator to see what's going on with our Moving Averages.
We can define two Plots using the `Plot<N>(<source>, "Plot Name", <color>)` functions where:
* `N` is the numerical identifier for the plot (going from 1 to 100).
* source is the value to be plotted
* "Plot Name" is a string defining the plot's label
* color: the color of the plot, where you can choose from a list of predefined constants (red, blue, green, ...) or define one using the function `RGB(red, green, blue)` where all three of the values go from `0` to `255`
So you can just add the following lines at the end of the previous code:
```
```
We've done it!
Just like that you've applied your coding skills and wrote your first strategy, now you've got all the tools to create your own trading masterpieces.
What now?
So we're done creating our script... But what now?
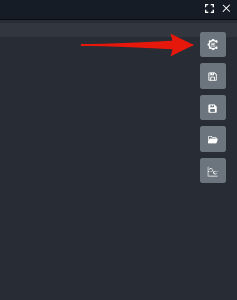
On the right action panel we'll be able to save and compile the formula, so we can use it.
Just click the Save and Compile button and name your script.
If everything was done right, we should get two green notifications telling us everything works fine.
Once saved with a name, you can see the tab title change and can find the script in the Open window to edit it further another time.
Now that our script is compiled we can open a chart, click on add indicators, and find our Script by searching its name in the search bar OR find it under the My WealthScripts category.