Categories
About UsHow to get startedAccount AccessBrokers and TradingChartsCloud Scanner
Unlock the power of precision with our cutting-edge scanner integrated with the Ichimoku Cloud indicator! Seamlessly navigate the markets with confidence as you harness the insights of this renowned indicator, now at your fingertips. Stay ahead of the curve by scanning multiple markets simultaneously, identifying key trends, support, and resistance levels with unparalleled accuracy.

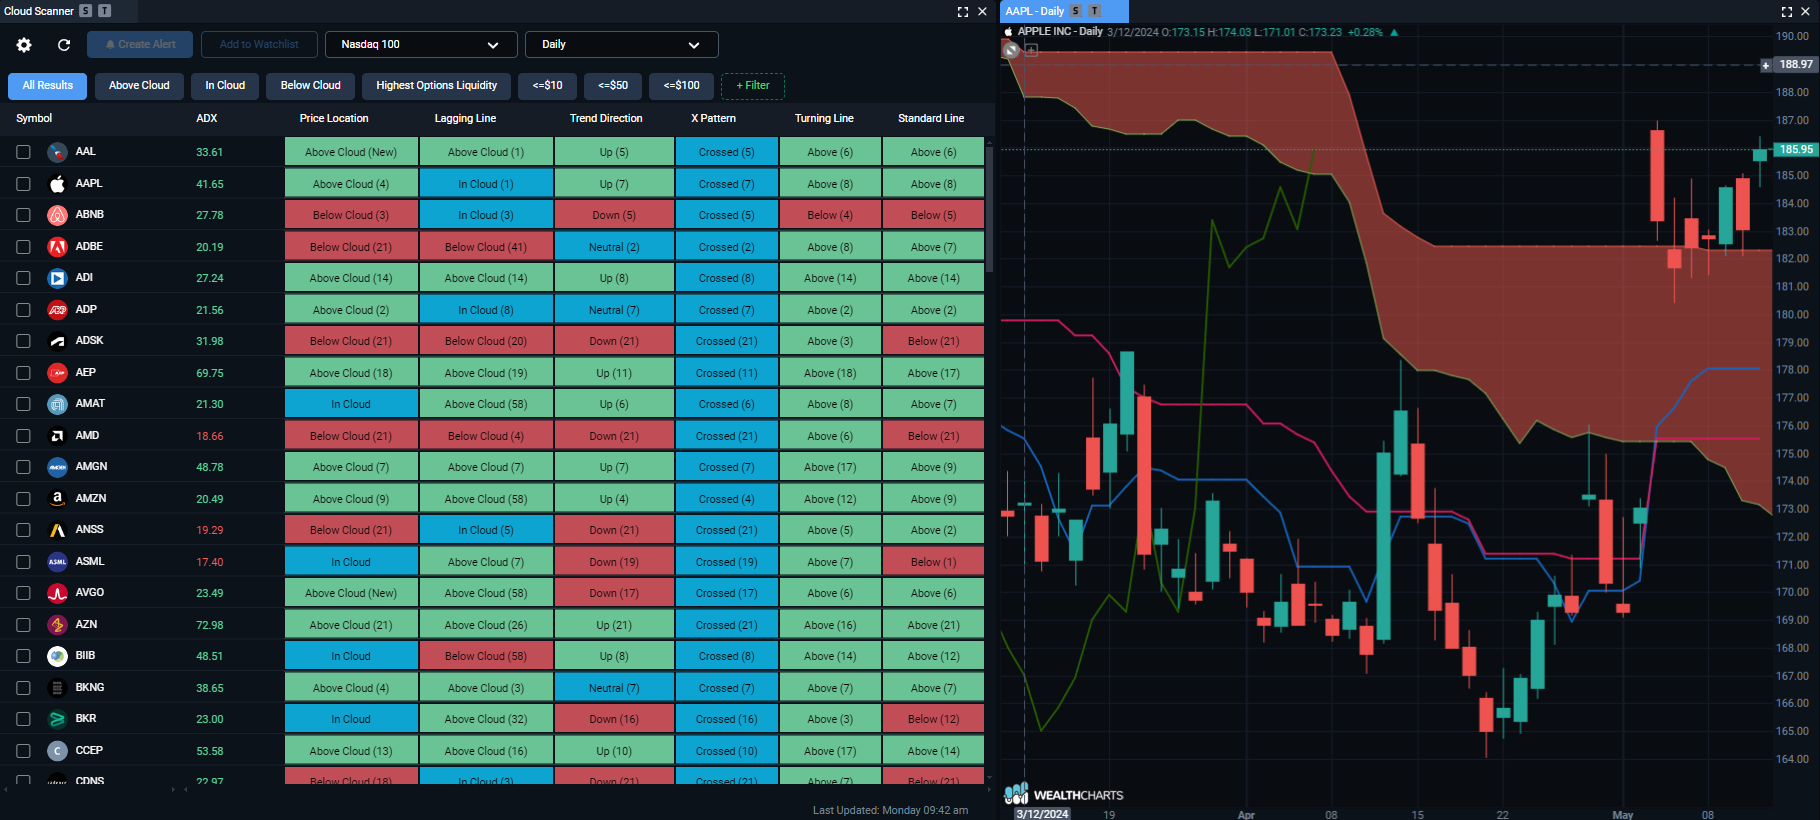
1. Ichimoku Cloud Scanner Settings: Take advantage of hiding certain columns, changing the "Add to Watchlist" shortcut to send symbols to any Watchlist you've made and the Accelerator Mode.
2. Symbol & Timeframe link: Link the Cloud Scanner to your charts and click on any of the symbols to change them! Make sure that the Cloud Scanner and Charts are linked with the same color.
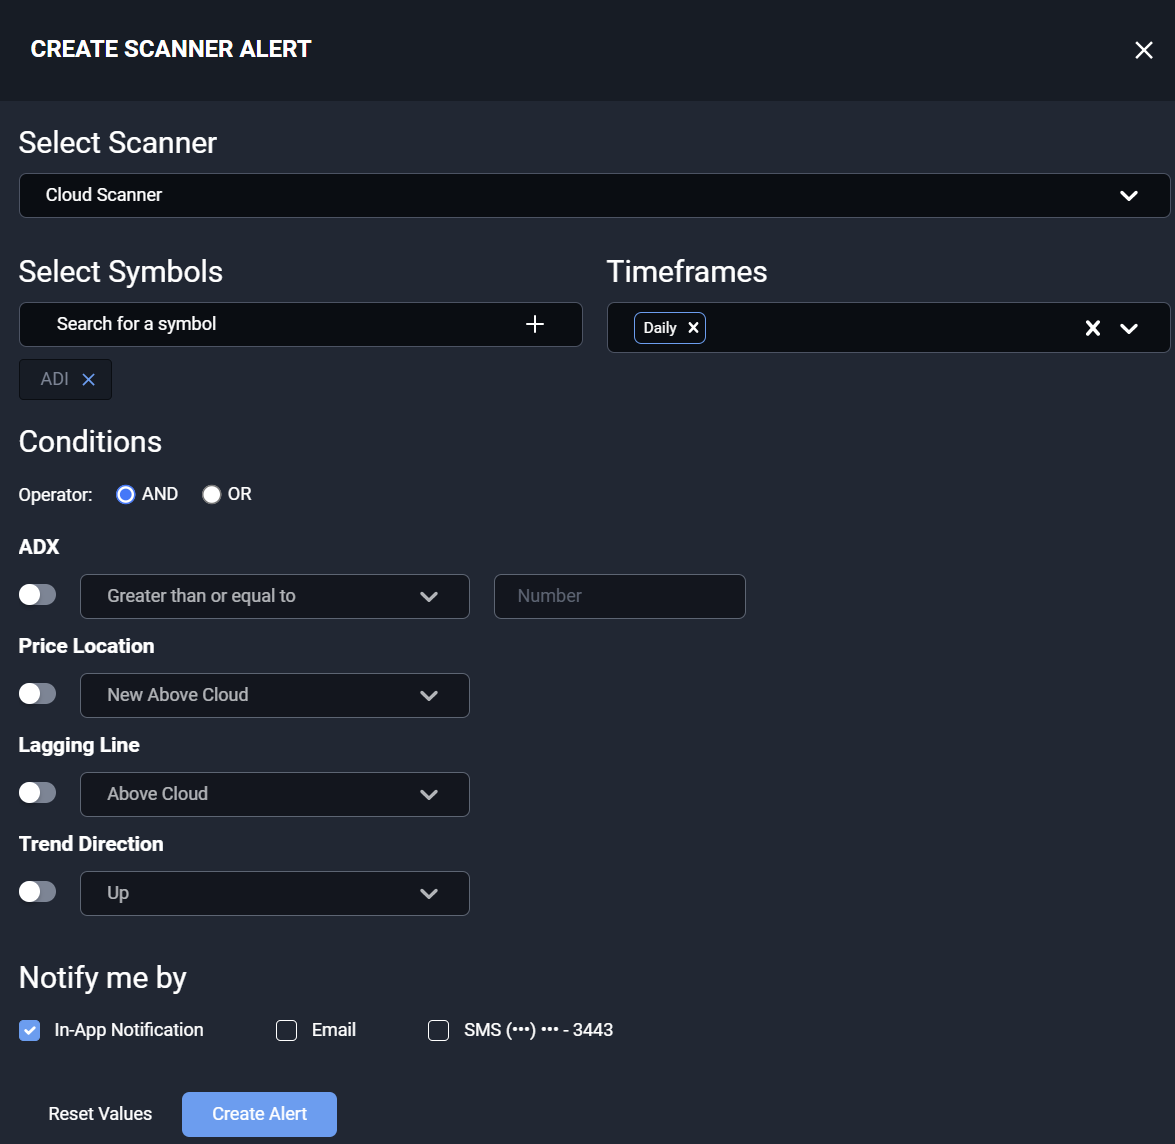
3. Create Alert & Add to Watchlist: Want to create a Scanner Alert or add a symbol to your watchlist? Be sure to check the box by the symol and the two buttons will light up allowing you to move to the next step.
4. Timeframe Dropdown & Market Basket: Click these dropdown menus to view the different timeframes and different market indices. The Cloud Scanner will update and you will get different results for each selection.
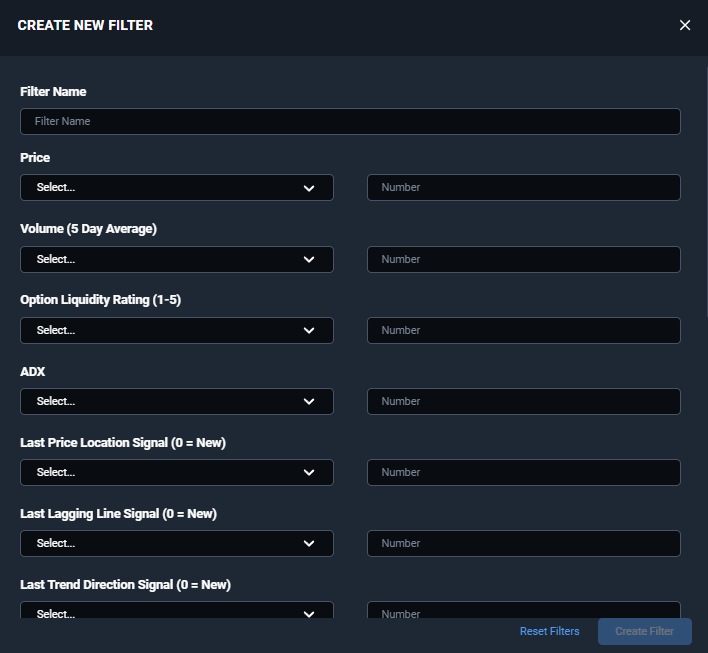
5. Cloud Scanner Quick Filters: Tailor the Cloud Scanner to your liking. Filter out the noise by specifically filtering for companies that are at certain prices, or with certain Volume and Option Liquidity. You can also filter for specific signals! You can use the pre-built filters that are already there or you can select the green dashed "Filter" button to make your own! Take a look at the picture below to see some of the different items you can filter for.
6. Cloud Scanner Grid:
Symbol: This column shows the different symbols that are in the scanner. Click the column header to sort through the symbols alphabetically A-Z or Z-A.
Volume: The 5-day average of the company's Volume.
Option Liquidity: Get a 1 - 5 star rating for how liquid the options are on the stock.
Price: This column shows the last updated price that the Cloud Scanner calculated.
The remaining columns are below. These columns interact with the different signals firing off from the Ichimoku Cloud indicator on the charts.
Indicator Column ADX
Indicator Column Price Location
Indicator Column Lagging Line
Indicator Column Trend Direction
Indicator Column X Pattern
Indicator Column Turning Line
Indicator Column Standard Line
To learn more about the Ichimoku Cloud Scanner take advantage of Hubert Senters' classes that have been recorded and placed into the WealthChartsTV component!