Categories
About UsHow to get startedAccount AccessBrokers and TradingChartsSeasonality Stats
Compare Year To Year Performance At A Glance!
For traders interested in diving into an individual symbol performance over the years during a defined period of time, Seasonality Stats can provide the exact insights they’re looking for!
To locate the Seasonality Stats component, you will want to go to the Main Menu icon at the top left corner of the platform. Go to Premium Features and you will see it there.
If you do not have Seasonality on your charts, the Seasonality Stats component will load up looking like this:
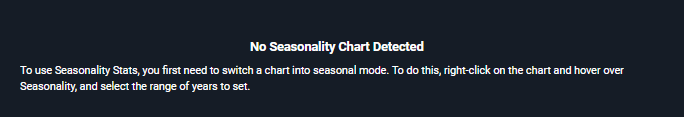
To turn Seasonality on for your charts, you will want to right-click anywhere on the chart, hover over Seasonality and select 5 years, 10 years, 15 years, or 20 years. You can change this at anytime.
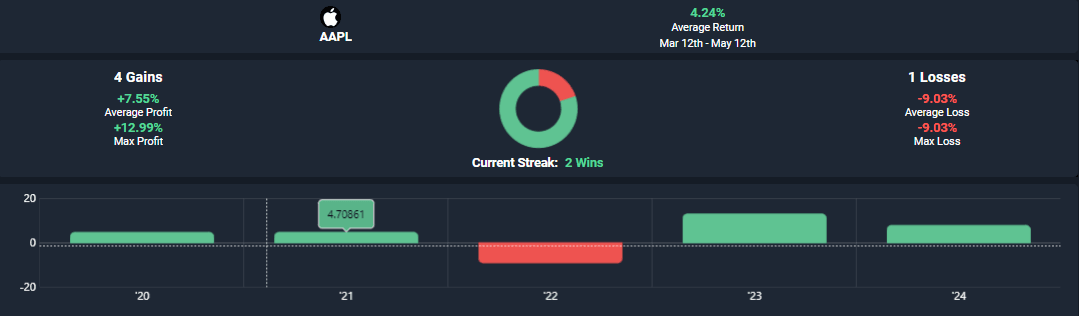
Along with the Seasonality curve now on your chart, you will also see 2 vertical lines. Dragging either of those lines will change the date range that you see at the top left in the Seasonality Stats component. You can adjust these lines at anytime within a year's worth of dates giving you different results of that instrument. In the image below, you will see a section that says "4 Gains" and "1 Losses". This is looking at the graph directly below and telling you the data from the amount of years you selected. In this example, we had selected 5 years.
To turn Seasonality off, simply right-click anywhere on your chart again, hover over Seasonality, and then select "Turn Seasonality Off".
To see the Seasonality Stats in action, view the video below for more: