Categories
Seasonality Scanner
Identifying cyclical market patterns just got easier!
To find Seasonality and load it onto your screen, go to the Main Menu and click on Premium Features. There will be two features to utilize called Seasonality Scanner and Seasonality Stats.
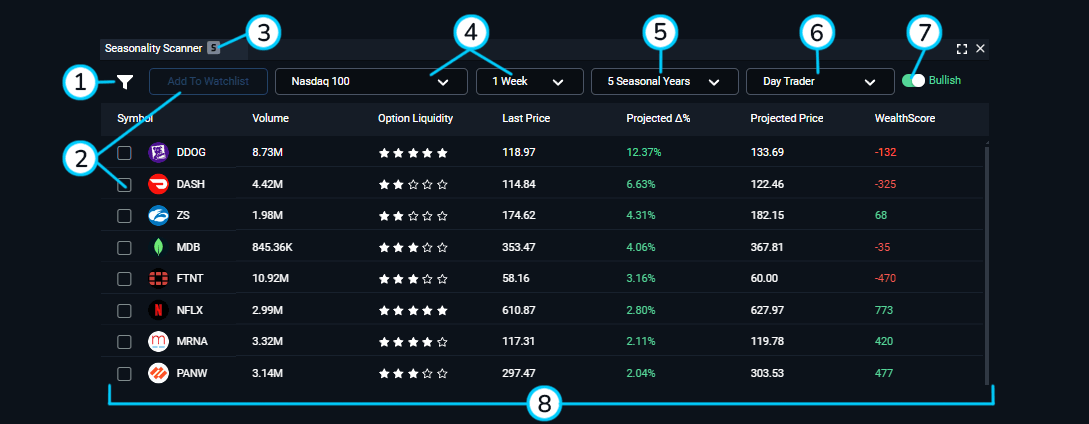
1. Filter Menu: This is where you can change the settings and filters on the Seasonality Scanner feature. Review the bottom of this article to learn more!
2. Add to Watchlist: Looking to add a symbol to your watchlist that you've spotted on Seasonality Scanner? Be sure to check the box by the symbol and the two buttons will light up allowing you to move to the next step.
3. Symbol link: Link the Seasonality Scanner to your charts and click on any of the symbols to change them! Make sure that the scanner and charts are linked with the same color.
4. Market Basket and Projected Delta time limit: Click these dropdown menus to view the different delta times and different market indices. Seasonality Scanner will update and you will get different results for each selection. You may see the order of symbols change as well as the results in the Forecasted Delta Percentage and the Forecasted Price columns.
5. Seasonal Year dropdown: You can change this dropdown to show 5 Seasonal Years, 10 Seasonal Years, 15 Seasonal Years, and 20 Seasonal Years. Changing this may change the order of symbols as well as the results in the Forecasted Delta Percentage, Forecasted Price columns.
6. Type of Trader dropdown: You can change this dropdown to show Day Trader, Swing Trader, Position Trader, or Investor. Changing this section will change results in the WealthScore column.
7. Bullish / Bearish Toggle: Changing this button will show you different signals on your Seasonality Scanner. You will mainly see a larger difference in the Projected Delta percentage column. For bullish, you will see positive projection predictions and for bearish you will see negative projections.
8. Seasonality Scanner Grid:
Symbol: This column shows the different instruments related to the Projected Delta percentage column. Click the column header to sort through the symbols alphabetically A - Z or Z - A.
Volume: The 5-day average of the company's Volume.
Option Liquidity: Get a 1 - 5 star rating for how liquid the options are on the stock.
Last Price: This column shows the last updated price that Seasonality Scanner calculated.
Projected Delta percentage: This shows you the percentage of the prediction of where the instrument might go based on the Seasonality settings you have set in the Seasonal Year and Projected Dela Time limit dropdown.
Projected Delta: This shows you the prediction price of where the instrument might go based on the Seasonality settings you have set in the Seasonal Year and Projected Dela Time limit dropdown
WealthScore: This score is coming from WealthScanner. A popular scanner on WealthCharts that many Ultimate members enjoy using! To change the algorithm behind the WealthScore column in Seasonality Scanner, you will want to change what type of trader you are located at the top of the scanner. You have the option to change from a Day Trader, Swing Trader, Position Trader, and a Investor. When you change the type of trader, you will see the scores change. To learn more about the different scores from the scanner, be sure to check out the related articles below to learn more about WealthScanner!
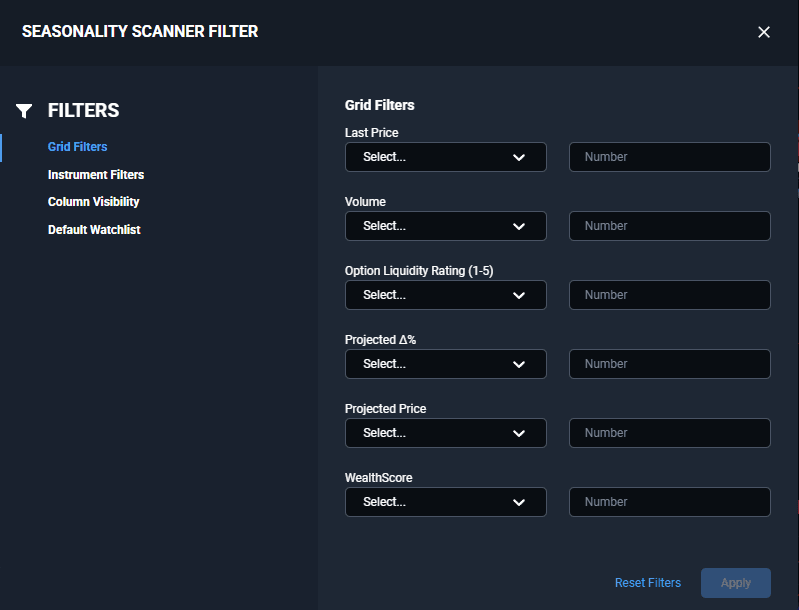
Seasonality FIlters: Tailor Seasonality to your liking. Filter out the noise by specifically filtering for companies that are at certain prices, or with certain Volume and Option Liquidity. You can also filter for specific WealthScores! Take advantage of hiding certain columns, changing the "Add to Watchlist" shortcut to send symbols to any Watchlist you've made.
To see the Seasonality Scanner in action, view the video below for more: