Categories
About UsHow to get startedAccount AccessBrokers and TradingChartsSectorScanner
SectorScanner is the perfect tool for flagging stocks and sectors that are in motion and expected to stay in motion, helping users get on the right side of trends. Unlike standard sector analysis, WealthCharts has built a unique algorithmic component into this tool.
To find the SectorScanner, click on the Main Menu icon up at the top left corner of your platform and then go to Premium Features. After that, load up the scanner, and you will see that it looks similar to the images below.
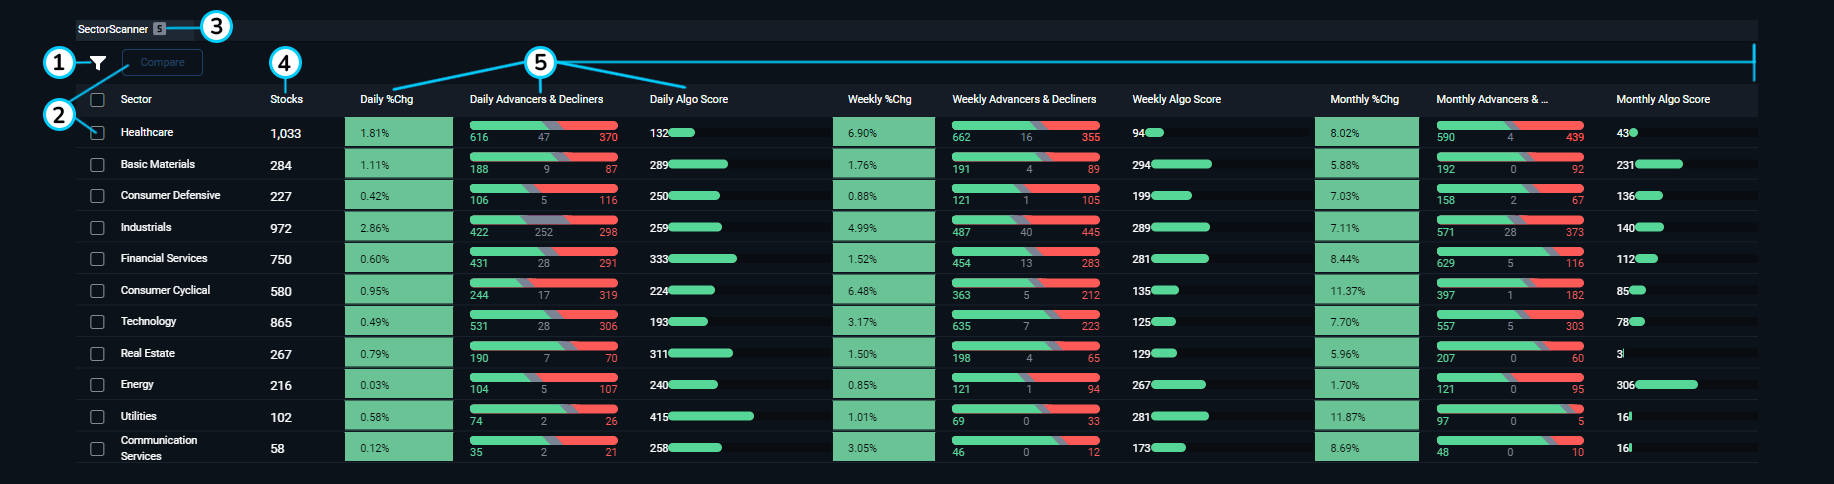
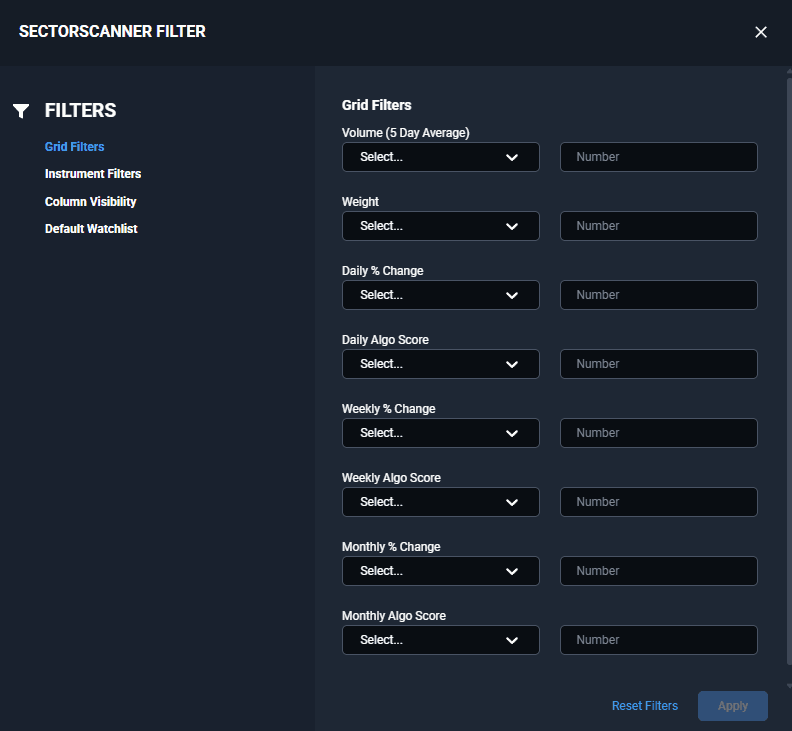
1. Filter Menu: This is where you can change the settings and filters of the SectorScanner feature. You can filter for certain results, hide certain columns, and change your default watchlist when adding symbols!
2. Compare Sectors: Ready to go to the next page of the SectorScanner? Click on one or more sectors or subsectors and you will see the blue "Compare" button light up at the top.
3. Symbol Link: Link the SectorScanner to your charts and click on any of the symbols to change them! Make sure that your SectorScanner and Charts are linked with the same color.
4. Stocks Column: This column shows you the number of stocks in each sector or sub-sector.
5. SectorScanner Grid: This is where you will see Volume, Weight percentages, Delta percentages, Daily Advancers and Decliners, and Algo Scores. Each symbol should have it's own Algo Score from AlgoHunter, however, when combined with a Sector and Subsector, it becomes averaged. For the delta differences, these numbers refer to the sector and subsector % change deltas, meaning they represent the difference between the individual stock's % change and the sector/subsector they belong to.
For example, lets presume BAC had a daily % change of 35%, the Banks sector it belongs to had a % change of 15%, and the Diversified subsector that it belongs to had a % change of 10%. In this case the Sector % Delta for BAC will be 35-15=20% ( it is outperforming it's parent sector by 20%), and the subsector % change delta would be 35-10=25% (it is outperforming it's subsector by 25%)
Did you know?
Did you know that you can now find an individual stock within SectorScanner? All you have to do is click on the funnel icon located at the top left corner of SectorScanner and then select "Instrument Filters". This will take you to an area where you can enter individual stocks or your own custom Watchlists to learn more about them from SectorScanner!
You can also change the Average Volume in SectorScanner by selecting the dropdown button located at the top left corner of the feature. Don't forget you can also show ETFs only by toggling the switch at the top of SectorScanner too!
Get to the SectorScanner feature by clicking on the About tab when you are in the Symbol Info feature on WealthCharts. This is where you can see each industry and sector for the symbols you have loaded in that feature as well!
Watch this video to learn more about SectorScanner: