Categories
About UsHow to get startedAccount AccessBrokers and TradingChartsWealthCharts Portfolio
Keep your finger on the pulse of your investments with our advanced portfolio system! Stay informed and in control as you track your trades with precision and ease. Our user-friendly interface allows you to monitor performance, analyze trends, and make adjustments on the go. Whether you're managing a diverse portfolio or focusing on specific assets, our platform provides the tools you need to stay ahead of the curve.
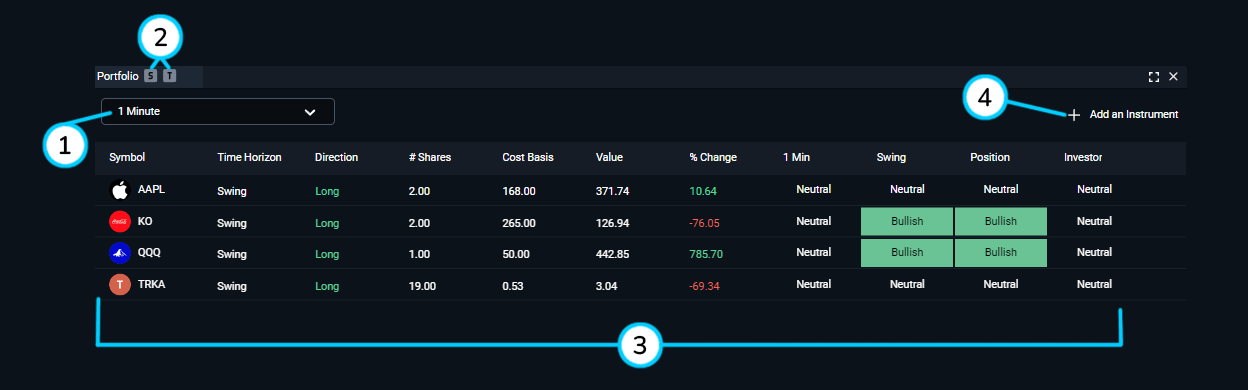
1. Timeframe Dropdown: Click this dropdown menu to view the different timeframes. The Portfolio component will change the column with the timeframe as the column header showing you neutral, bullish, and bearish signals depending on how the symbol is doing with the algorithms in the back end. The Portfolio feature will update when you change the timeframe to a different selection.
2. Symbol & Timeframe link: Link the Portfolio feature to your charts and click on any of the symbols to change them! Make sure that your Portfolio and Charts are linked with the same color.
3. Portfolio Grid:
Symbol: This column shows the different symbols that are in the scanner. Click the column header to sort through the symbols alphabetically A-Z or Z-A.
Time Horizon: This column shows you the the trading timeframe (how long you plan on trading) the symbol you selected.
Direction: This column shows you the direction you selected that you traded the symbol you entered into your Portfolio.
# Shares: This column shows the amount of shares you entered when you added the instrument into your Portfolio.
Cost Basis: This column shows you how much you told the Portfolio that cost you to buy the inserted instrument.
Value: This is the value of the instrument currently. When you reload Portfolio or refresh the web browser this column will be updated. It does not update in real-time at this moment.
% Change: This column shows a percentage difference from the Cost Basis and the current price of the instrument.
Timeframe: This column shows the signals firing off for the timeframe you selected from bullet 1.
Swing: This column shows signals firing off from a swing-trading perspective.
Position: This column shows signals firing off from a position-trading perspective. This timeframe is longer than swing trading timeframes.
Investor: This column shows signals firing off from a investor-trading perspective. This timeframe is longer than position trading timeframes.
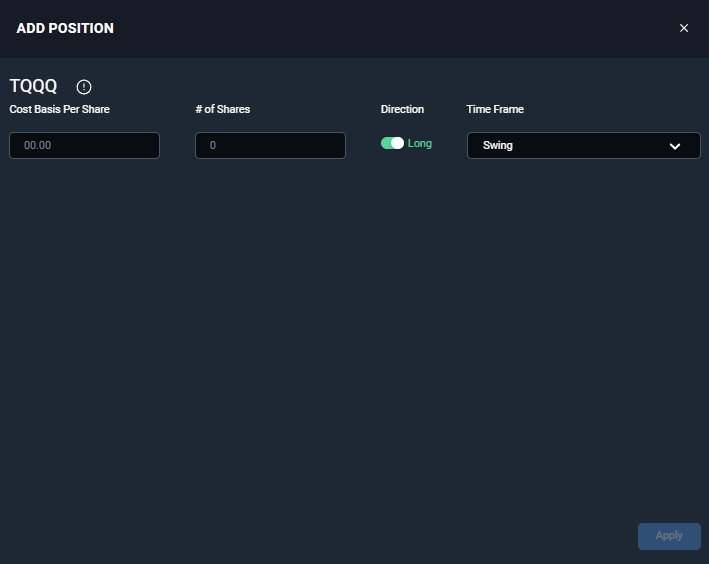
4. Add an Instrument button: Selecting this button will take you to a menu where you can insert the symbol you'd like to add to your WealthCharts Portfolio as well as the cost basis, number of shares, long or short direction, and the Time Frame you plan on trading the symbol.
Did you know that when you hover over each symbol, you can remove or modify the entry? Simply refer to the right side of the component and hover over the row to select the pencil and square icon to modify the entry or the "x" icon to remove it.