Categories
About UsHow to get startedAccount AccessBrokers and TradingScannersResearch ToolsCommunityStocksOptionsFuturesAlertsMobile AppCompare Charts
Comparing charts is essential for a lot of traders. It's a space cruncher too! Easily see where trends of other markets are all on one chart.
To get started with comparing charts, simply search for an instrument by clicking on the magnifying glass icon up at the top left corner of your platform. After that, you will see two columns of icons towards the left of your search. Selecting the two arrows forming a square icon will add the searched instrument to your chart. By default, you should see purple candlesticks appear on your chart.
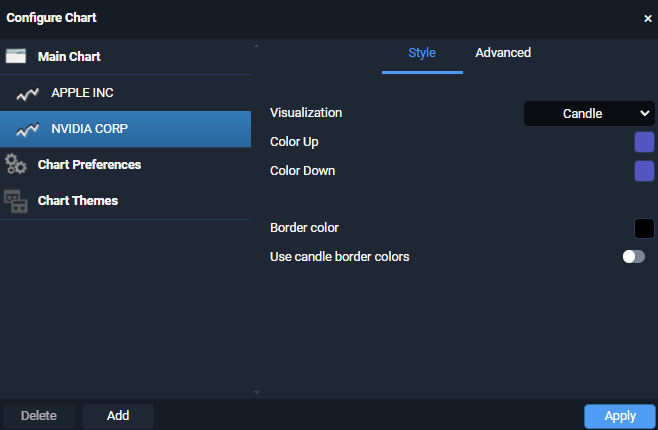
Looking to change the colors and settings of your compared instrument? That's easy! Right-click anywhere on your chart and then select Configure Chart. Locate the compared instrument in the left-side list and change the Visualization, Color Up, Color Down, Border Color, and more!