Categories
About UsHow to get startedAccount AccessBrokers and TradingScannersResearch ToolsCommunityStocksOptionsFuturesAlertsMobile AppConfigure Chart
Configure Chart is a very important menu, that serves a number of different purposes. Here, you can change chart settings, such as background, text, and border colors, Add or remove indicators, or adjust their settings. This menu can be called up by right-clicking the chart and selecting “Configure Chart” from the dropdown.
The Configure Chart menu is split into two parts. The area on the left contains types of settings that can be adjusted. The area on the right contains individual settings within that category.
Main Chart Settings
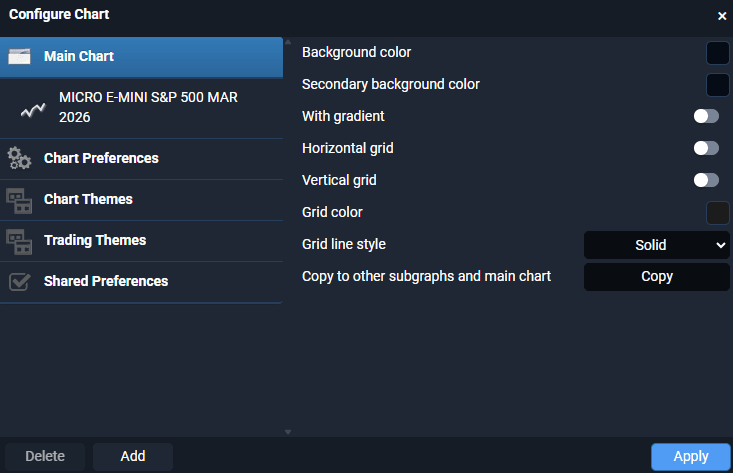
Here are some of the key settings for the main chart area where the prices and candles are contained. This includes settings such as the background colors, gradients, grid lines, and their style and colors. At the bottom, there’s also a “copy to other subgraphs” button, which allows you to pass any of the settings configured here into any chart subgraphs automatically.
Subcharts
Any indicators that occupy separate dedicated slots at the bottom of the chart, will reside in containers that are labeled as subgraphs or subcharts. Such subcharts are numbered based on their order on the chart and can be adjusted separately with various settings that are identical to the main chart area.
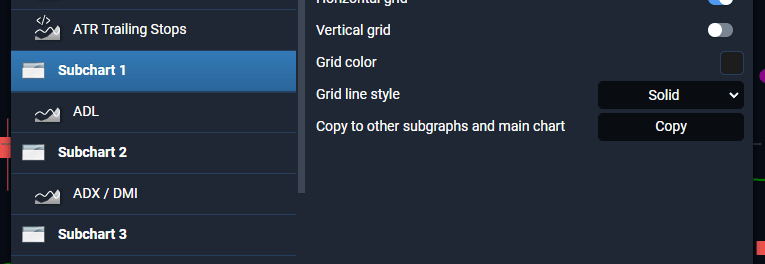
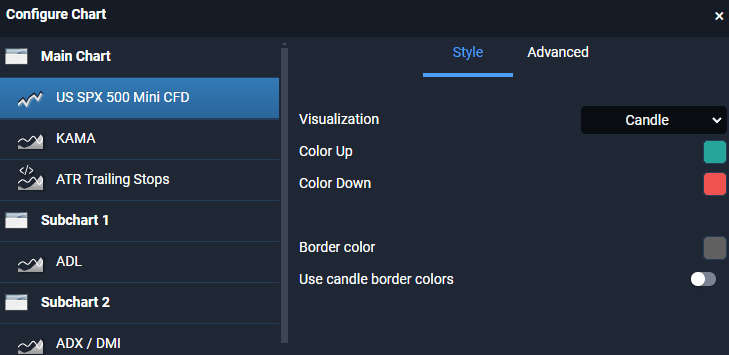
Chart Symbol Settings
Typically, the second category on the list of settings will be labeled after the symbol that is currently being displayed on the underlying chart. We call this the “Symbol Settings” menu, and this is the home to a variety of chart settings that affect the price action on the chart: Visualization (bar style), color settings for bars that closed above the open (Color Up), or below the open (Color Down) and a border that can be enabled around your candles.
This menu also has a second tab, called “Advanced”:
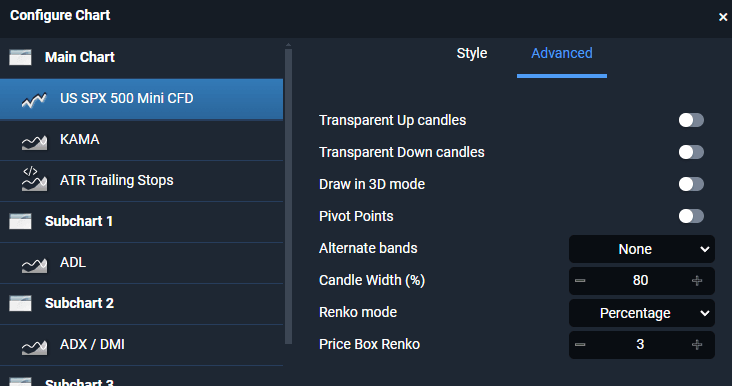
Here you will find very important settings that allow you to enable or disable hollow-body candles (Transparent Up/Down Candles), a fancy visual effect called 3D mode, candle body width settings, and important inputs for the Renko chart bar style.
Chart Preferences
Some general chart settings that span all chart areas are accessible here.
These include color of the background and the text labels that surround the chart (where the timestamps and price levels are), the color of the borders that separate the various subcharts, chart background highlight colors used in the trade simulator tool, default color settings for chart overlays, and a setting for the amount of empty space that is contained on the right side of the chart after the last bar. A handy “Restore Theme” button is also available here if you would like to restore the factory default settings on your chart.
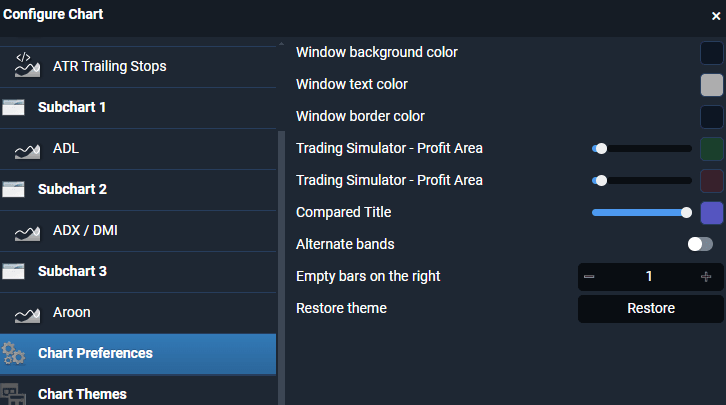
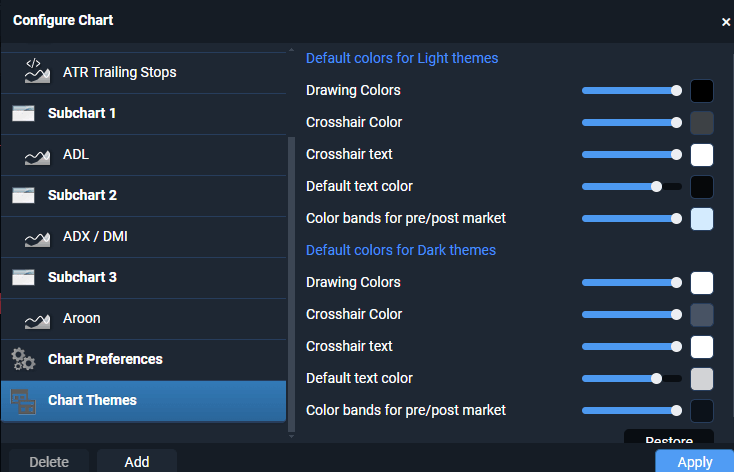
Chart Themes
Depending on whether you are using light or dark mode for your trading platform, some settings can behave differently. Here, you will find two sets of identical settings: one for dark mode, and one for light mode. These settings include some of the items that might end up blending in with their backgrounds depending on what theme is being used:
- Default colors for drawing tools such as trend lines and freehand drawings.
- Default color for the background of the price label projected by the crosshair.
- The text color of the crosshair price label in the price scale.
- The default color for any elements that include text labels.
- Background color highlights for pre- and post-market data.
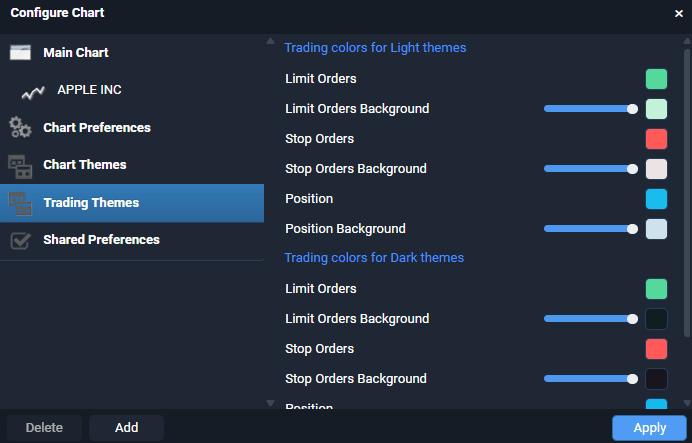
Trading Themes
When you place trades on your chart, you may see your Position, Limit Orders, Stop Orders, or a Liquidation indication. You can change the colors of these indications in the Configure Chart!
The last option on the left menu is Trading Themes and when you select it, you'll see that you are faced with a Style tab and an Advanced Tab. Style shows each of the items except Liquidation. If you click on the Advanced tab, you will see the color change options for the Liquidation indication.
Shared Preferences
The Shared Preferences section in the Configure Chart menu allows members to customize the lines that show on their orders. If the boxes for your trading indicators appear on the right side of your chart, selecting the "Extend trade line" toggle, will make the dashed or solid line continue throughout the left side of the chart.
You also have the ability to change the line size and line style for your orders and positions!
<a href="https://gyazo.com/7eef617c9970f77adfe155fb039f9fb1"><video width="908" autoplay muted loop playsinline controls><source src="https://i.gyazo.com/7eef617c9970f77adfe155fb039f9fb1.mp4" type="video/mp4"/></video></a>
Adjusting indicators
A full list of any indicators that are present on your chart will also be available here. Any indicator can be selected from this list if you would like to edit its settings. Indicator settings are typically split into three categories:
Style – Here you can enable and disable individual indicator plots and adjust their colors and styles. An on/off toggle is available to disable them, the style can be accessed in the dropdown menu next to the plot name, and the color can be adjusted by clicking the color-coded box on the right.
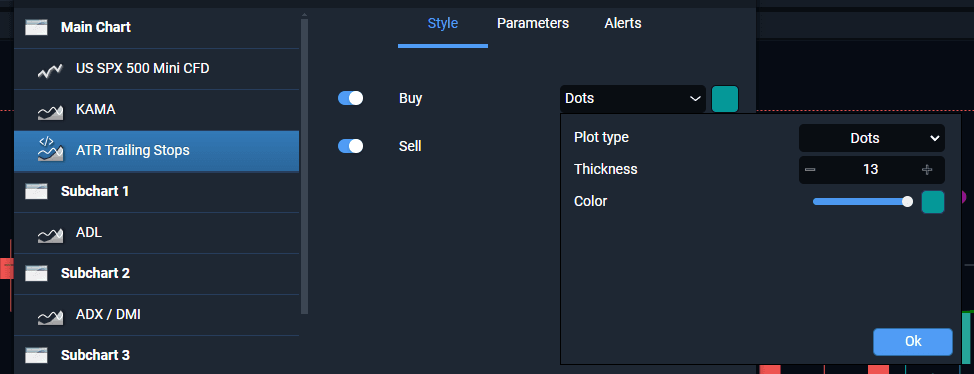
Parameters – Here you will find any of the indicator inputs that can be adjusted. These are typically indicator inputs and settings that are used in the indicator calculations as it plots data on the chart.
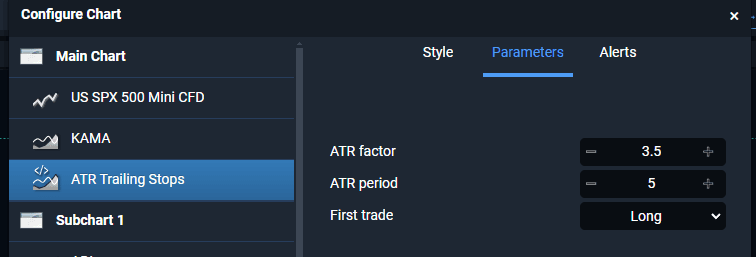
Alerts – Some indicators are capable of generating notifications at the top of the chart when important events happen based on that indicator’s strategy – a new signal pops up, an important color change, etc. These types of notifications can be enabled and disabled here.
Removing Indicators
If you would like to remove and indicator off your chart, this is also the right place. To remove an indicator, simply select it in the list, and then click the “Delete” button in the bottom left corner of the Configure Chart window.