Categories
About UsHow to get startedAccount AccessBrokers and TradingScannersResearch ToolsCommunityStocksOptionsFuturesAlertsMobile AppGlobal Chart Settings
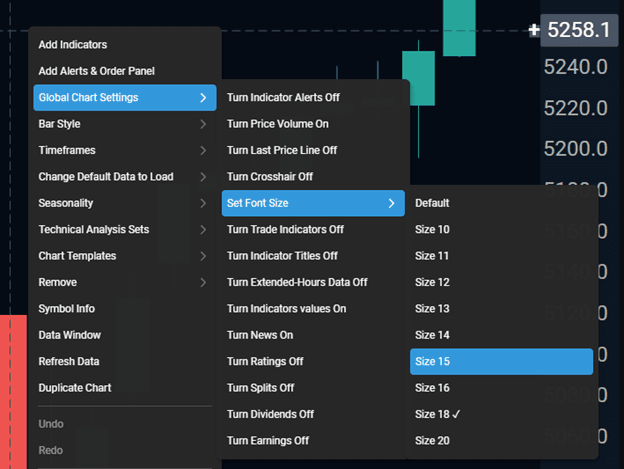
Global Chart Settings are available to you in the Chart Toolbar on the left of the screen, or in the right click menu. These are global settings that can be toggled on/off for your charts, but keep in mind that these have global effect, and will influence all your charts, across all your dashboards and layouts.

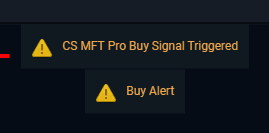
Turn Indicator Alerts On/Off
This is a toggle for turning off notification messages that some of the indicators plot at the top of your charts when important events happen based on that indicator’s strategy. These are not audible and should not be confused with Email/SMS Scanner Alerts.
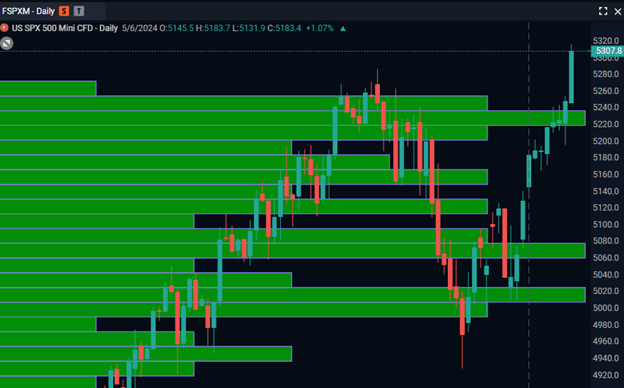
Turn Price Volume On/Off
This toggle allows you to turn on price volume bars on your chart – this tool is designed to give you an idea of how many trades took place at certain price levels.
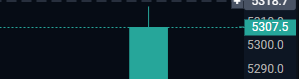
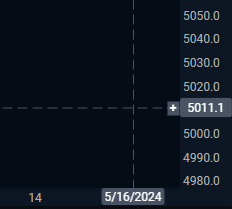
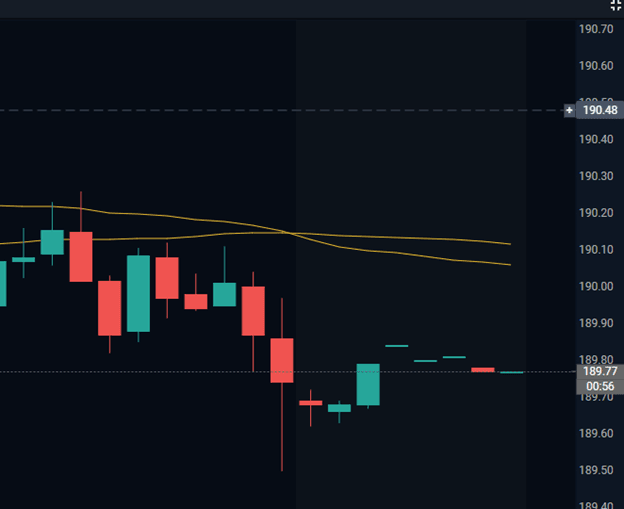
Turn Last Price Line On/Off
This setting turns the last price line on and off on your charts.
Turn Crosshair On/Off
The crosshair that follows your mouse cursor and projects on to the price and time scales can be turned on an off using this setting.
Set Font Size
This setting allows you to greatly increase the font size that is used for the time stamps and price labels on your charts.
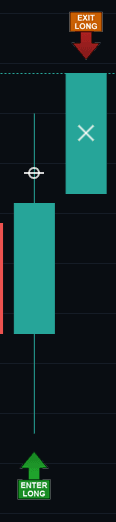
Turn Trade History On/Off
See your trades right on your chart! By turning on this setting, you will see labels at the top or bottom of the bars on your chart that will either say Enter Short, Exit Short, Enter Long, or Exit Long.
Move Trade Indicators to the Left or Right
This setting allows you to move the Trade Indicators that show up on your chart for orders and positions to the far left side of your chart or the far right side of your chart. To customize the location further, head over to the Chart Preferences area in the Configure Chart menu.
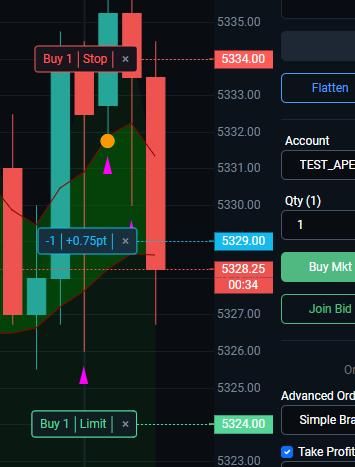
Turn Trade Indicators On/Off
This setting enables or disables the trade indicator boxes that show up on the right edge of your chart when a trade is active. To customize the style of these indications, head over to the Trading Themes area in the Configure Chart menu.
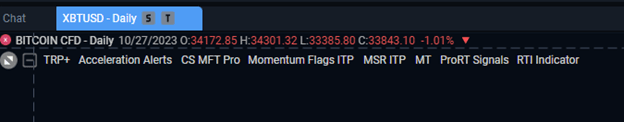
Turn Indicator Titles On/Off
This setting defines what the default state is for the collapsible menu containing a list of indicator titles that are on your chart currently – open or hidden.
Turn Extended-Hours Data On/Off
This toggle allows you to enable or disable Extended Hours data on your charts. Note that extended hours, when enabled, will also be highlighted on your chart with a different background color.
Turn Indicator Values On/Off
This setting controls whether indicator price values are projected onto the price scale of the chart.
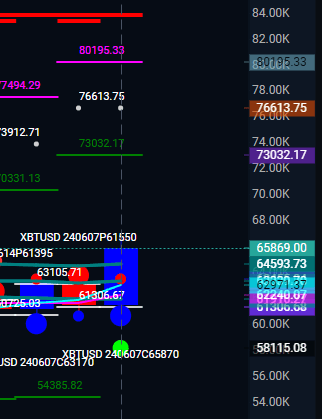
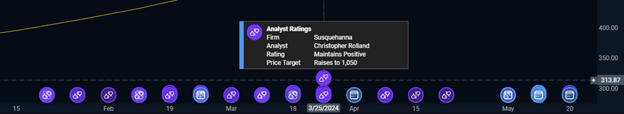
Chart Events – News, Ratings, Splits, Dividends, Earnings On/Off
By default, various types of events are plotted as little clickable circles at the bottom of your chart. Each circle can be clicked to access details about that specific event. These items can also be disabled using these settings that are available separately for each event type.