Categories
About UsHow to get startedAccount AccessBrokers and TradingChartsScannersCommunityStocksOptionsFuturesAlertsMobile AppFundHunter Research
The FundHunter Research tool is designed to help you analyze a wide range of research data for stocks and options, such as insider activity, institutional ownership, and IPOs, just to name a few. Here’s a closer look at what’s available:
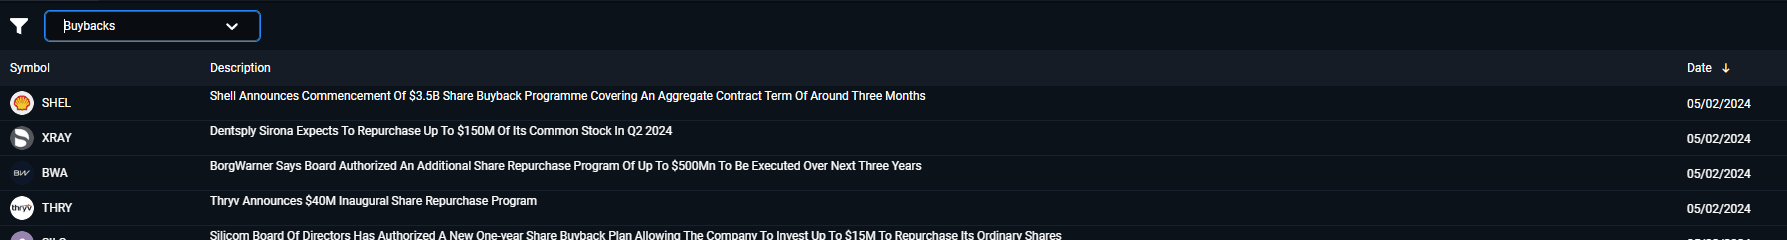
Buybacks
FundHunter Research offers a concise and chronological list of recent buybacks – any significant case where companies reacquire their own stock. These will typically come with a timestamp and a small description.
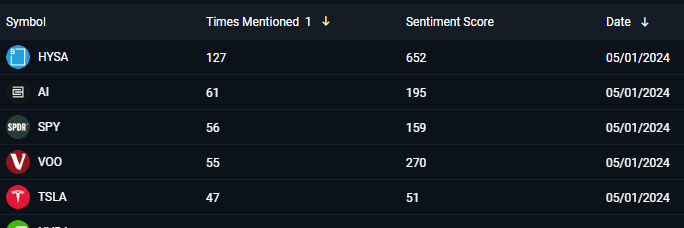
Social Reasons
FundHunter Research monitors some of the largest social networks for mentions of any stock names. When it does so, it also tries to analyze the context of the mentions, which is then expressed in a “Social Score” – this metric will tell you whether the mentions have been predominantly of a bearish or bullish sentiment.
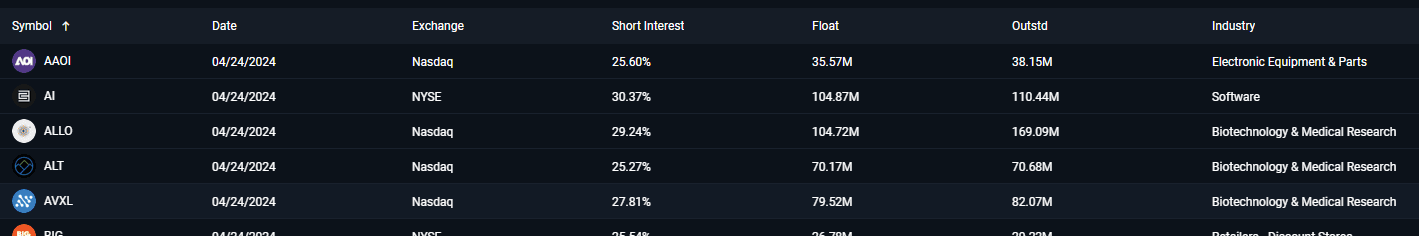
High Short Interest Stocks
This is a chronological list of any stocks that have reported high short interest numbers recently. Dates of sighting, industry groups, as well as specific numbers will be listed next to the stock names as well.
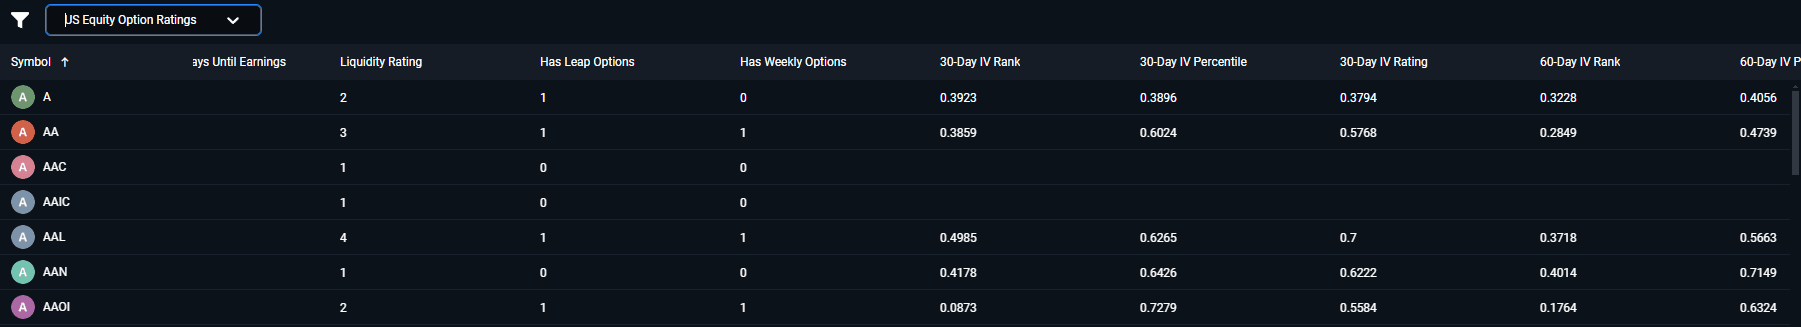
US Equity Option Ratings
Here, the tool offers extensive data on option liquidity and implied volatility – percentiles, rankings, and other details. Please note that this window has a very large number of columns with various types of data – do not forget to scroll sideways to get to them all!
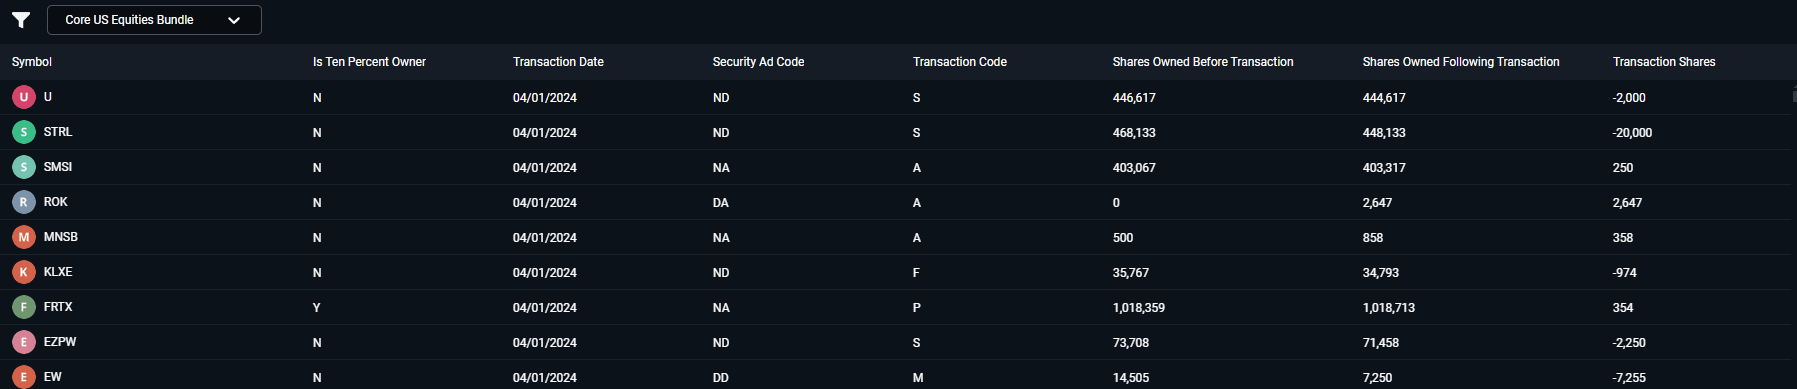
Core US Equities Bundle
This is the go-to tool if you would like to dive deep into data about insider trading. All high-ranking employees are required to disclose data about their trades in SEC Form 4 reports when trading the stock of the companies they are employed at. FundHunter Research aggregates this data for you, along with all the necessary details – who purchased, how much, what type of security, and more!
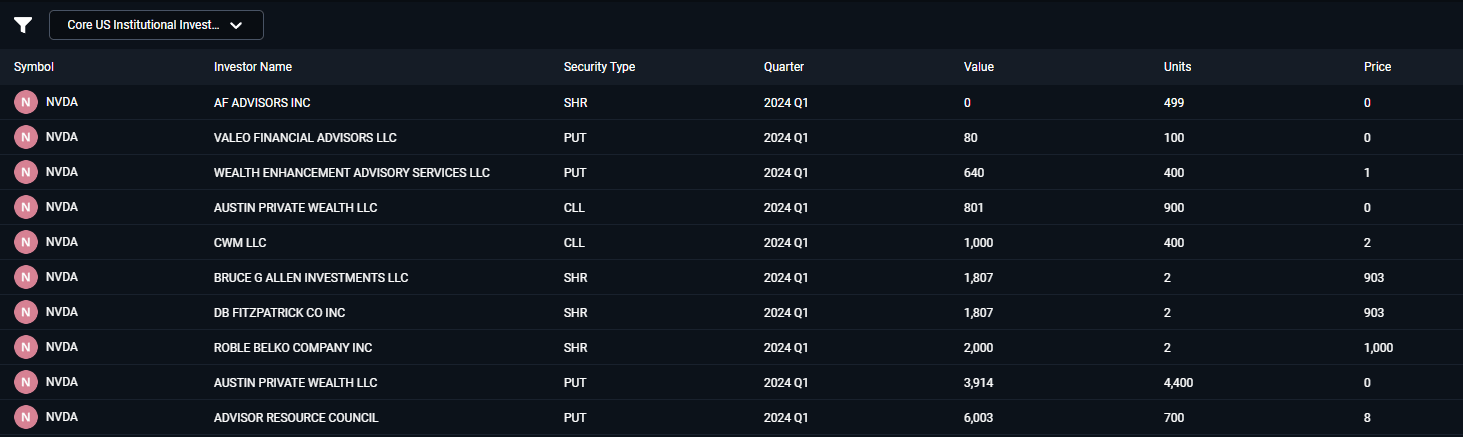
Core US Institutional Investors
This component requires you to pick a specific symbol that will be analyzed before it can be used. Make sure to pick one using the “Open Filter” dialog – you will see why this is necessary in just a moment! Once you have done this, you will be able to study a full list of all institutions that are invested in the stock that you have selected. This is an extremely long list for most major companies, hence the requirement to pick them one at a time. Of course, the list offers all necessary details, such as what type and number of securities have been purchased by each investor.
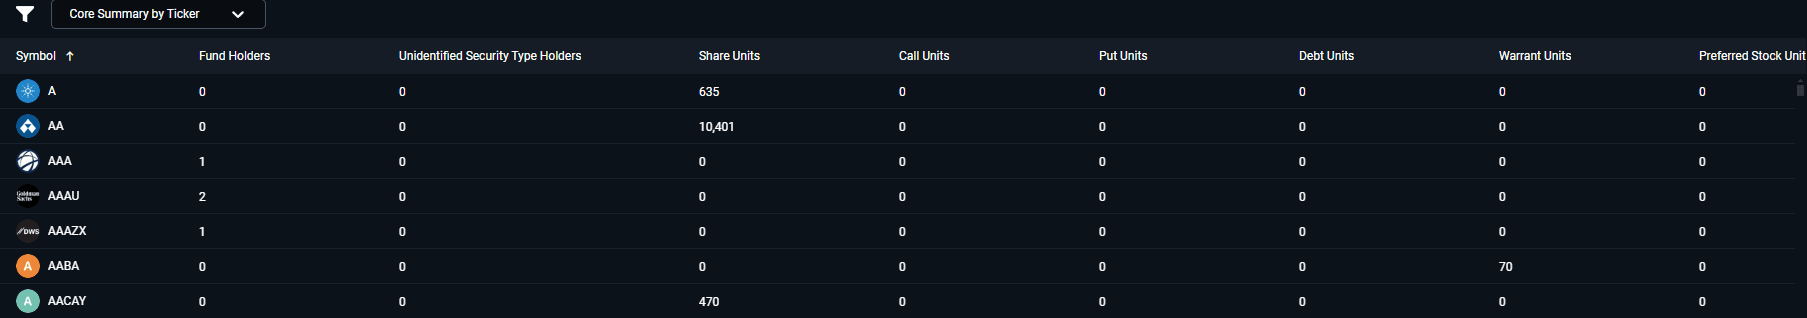
Core Summary by Ticker
This takes a different approach to analyzing institutional ownership and does not require any symbol filter to work. Here, you will see a detailed breakdown of how many shares are in circulation for each company, their types, values and more.
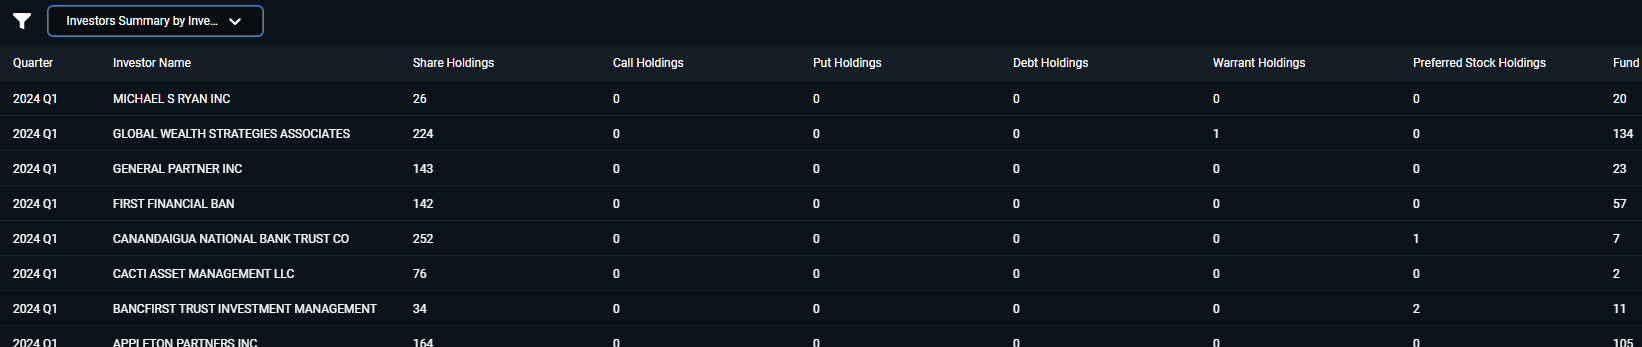
Investor Summary by Investor
Here, you get a detailed summary of institutional investors seen previously. The summary will include key numbers, such the number of holdings of various types, value, and percentage of total investment by type.
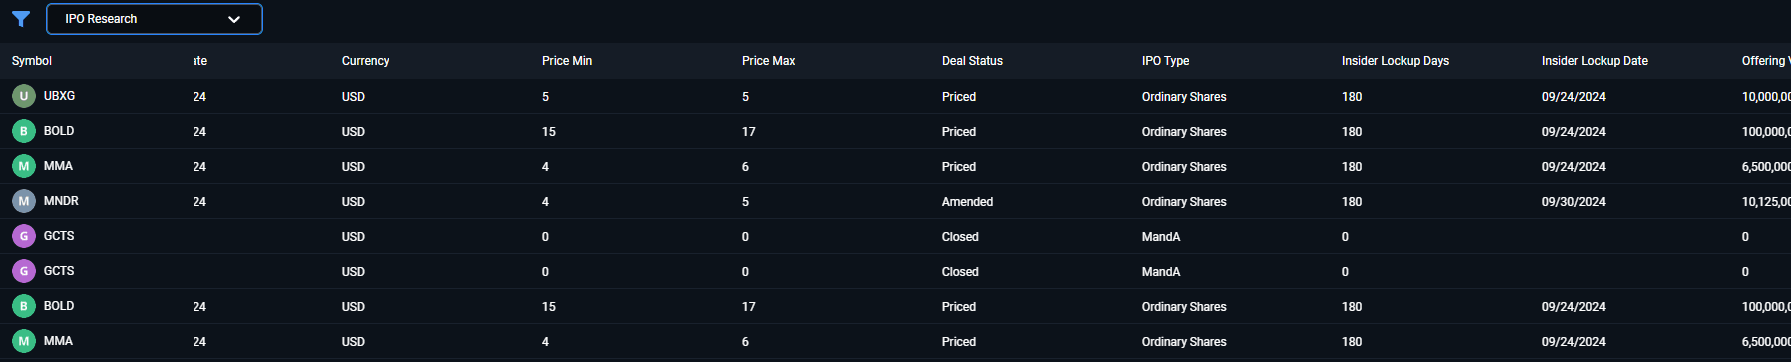
IPO Research
This tool offers details on past and upcoming IPOs – dates, pricing numbers, value, and others.
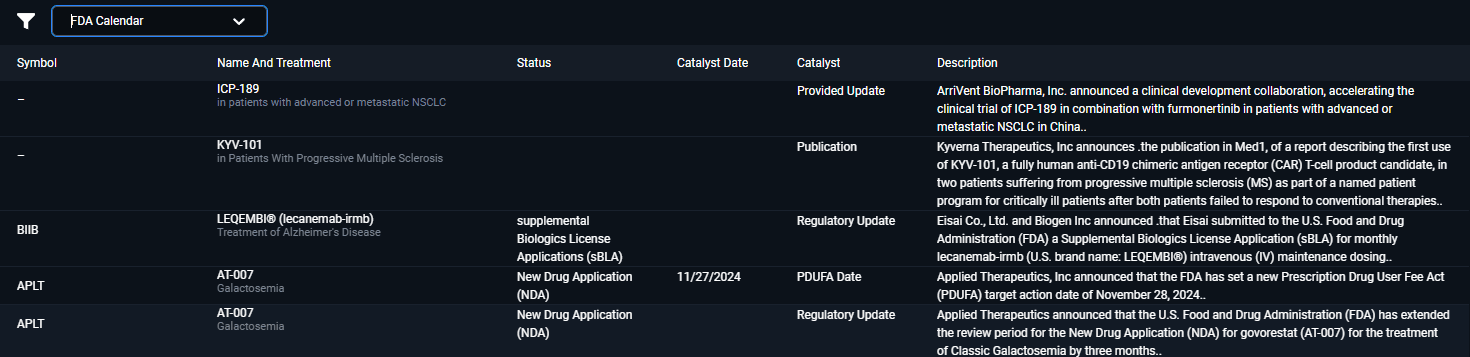
FDA Reports
Actions by the FDA can be an important driver behind stock prices of medical and consumer stocks. Here, you can study details concerning various important news reported by the FDA, their content, and of course which stock they are related to.
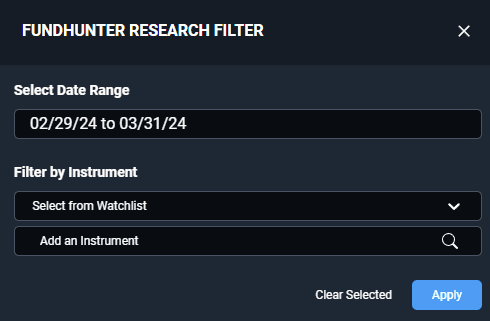
Filters
All of the aforementioned tools offer a set of filters that will help you pinpoint the data you are looking for – using these you can define a custom date range, symbol, or even symbol list that you would like to analyze.
To see the FundHunter Research component in action, please review the video below: