Categories
About UsHow to get startedAccount AccessBrokers and TradingChartsDivergence Tracker Scanner
Our advanced scanner identifies key divergences in real time, allowing you to spot shifts in market momentum like never before.
To find the Divergence Tracker Scanner, click on the Main Menu icon up at the top left corner of your platform and then go to Exclusive Features. After that, load up the scanner and you will see that it looks similar to the image below:
1. Filter Menu: This is where you can change the settings of the Divergence Tracker Scanner feature. You can hide certain columns and change your default watchlist when adding symbols!
2. Symbol & Timeframe link: Link the Divergence Tracker Scanner to your charts and click on any of the symbols to change them! Make sure that your Divergence Tracker Scanner and Charts are linked with the same color.
3. Create Alert & Add to Watchlist: Want to create a Scanner Alert or add a symbol to your watchlist? Be sure to check the box by the symol and the two buttons will light up allowing you to move to the next step.
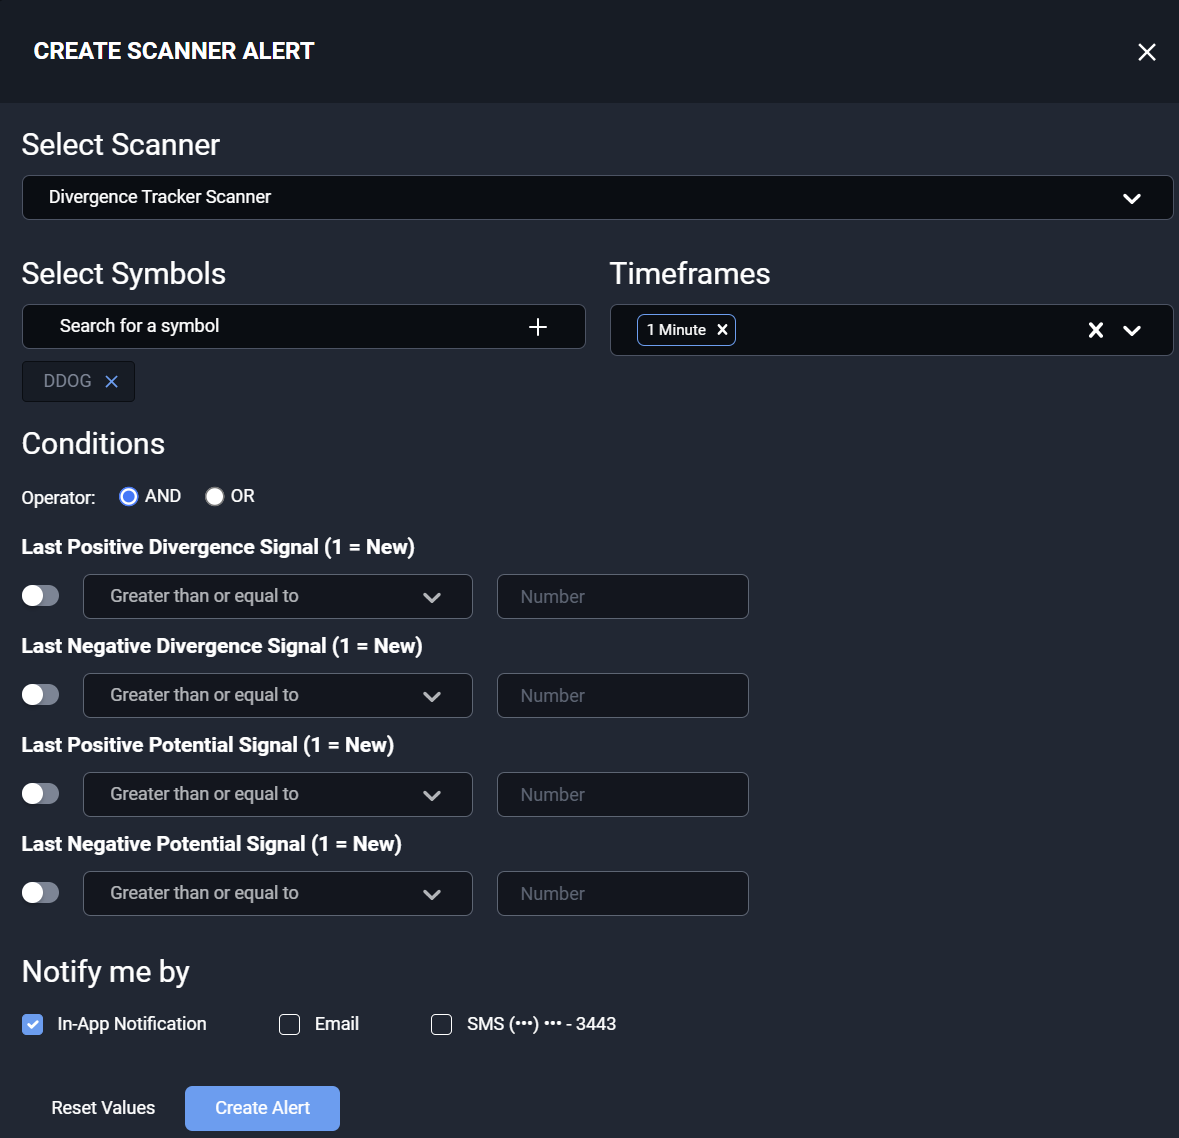
Be sure to review related articles below to learn more about setting up Scanner Alerts!
4. Timeframe Dropdown & Market Basket: Click these dropdown menus to view the different timeframes and different market indices. the Divergence Tracker Scanner will update and you will get different results for each selection.
5. Divergence Tracker Quick Filters: Tailor the Divergence Tracker scanner to your liking. Filter out the noise by specifically filtering for companies that are at certain prices, or with certain Volume and Option Liquidity. You can use the pre-built filters that are already there or you can select the green dashed "+Filter" button to make your own!
6. Divergence Tracker Grid:
Symbol: This column shows the different symbols that are in the top range for bullish or bearish signals in Divergence Tracker. Click the column header to sort through the symbols alphabetically.
Volume: The 5-day average of the company's Volume.
Option Liquidity: Get a 1 - 5 star rating for how liquid the options are on the stock.
Price: This column shows the last updated price that the Divergence Tracker Scanner calculated. Divergence Tracker Scanner refreshes once a minute.
Positive Divergence: This correlates to the cyan lines that are firing off on charts indicating positive divergence areas. You can click the headers to sort in ascending or descending order.
Negative Divergence: This correlates to the red lines that are firing off on charts indicating negative divergence areas. You can click the headers to sort in ascending or descending order.
Positive Potential: This correlates to the white lines that are firing off on charts indicating potential positive divergence areas. These lines will be located towards the bottom of candlesticks. You can click the headers to sort in ascending or descending order.
Negative Potential: This correlates to the white lines that are firing off on charts indicating potential negative divergence areas. These lines will be located towards the top of candlesticks. You can click the headers to sort in ascending or descending order.
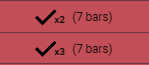
The x2 or x3 located to the right of the checkmark are indicating multiple divergences firing off in the same area when the signal appeared on the scanner.
Click the related articles below to learn about more exclusive tools and more!